MCHI Soars 45% as Chinese Equities Break Multi-Year Slump

Photo of Michael Williams
By Michael Williams Published

Quick Read

  • iShares MSCI China ETF (MCHI) gained 45% over the past year. The S&P 500 returned 19% in comparison.

  • MCHI allocates 17.5% to Tencent. The fund’s performance depends heavily on China’s gaming and social media giant.

  • KraneShares CSI China Internet ETF (KWEB) offers pure internet exposure without financial sector or state-owned enterprise holdings.

  • If you're focused on picking the right stocks and ETFs you may be missing the bigger picture: retirement income. That is exactly what The Definitive Guide to Retirement Income was created to solve, and it's free today. Read more here
This post may contain links from our sponsors and affiliates, and Flywheel Publishing may receive compensation for actions taken through them.
MCHI Soars 45% as Chinese Equities Break Multi-Year Slump

© 24/7 Wall St.

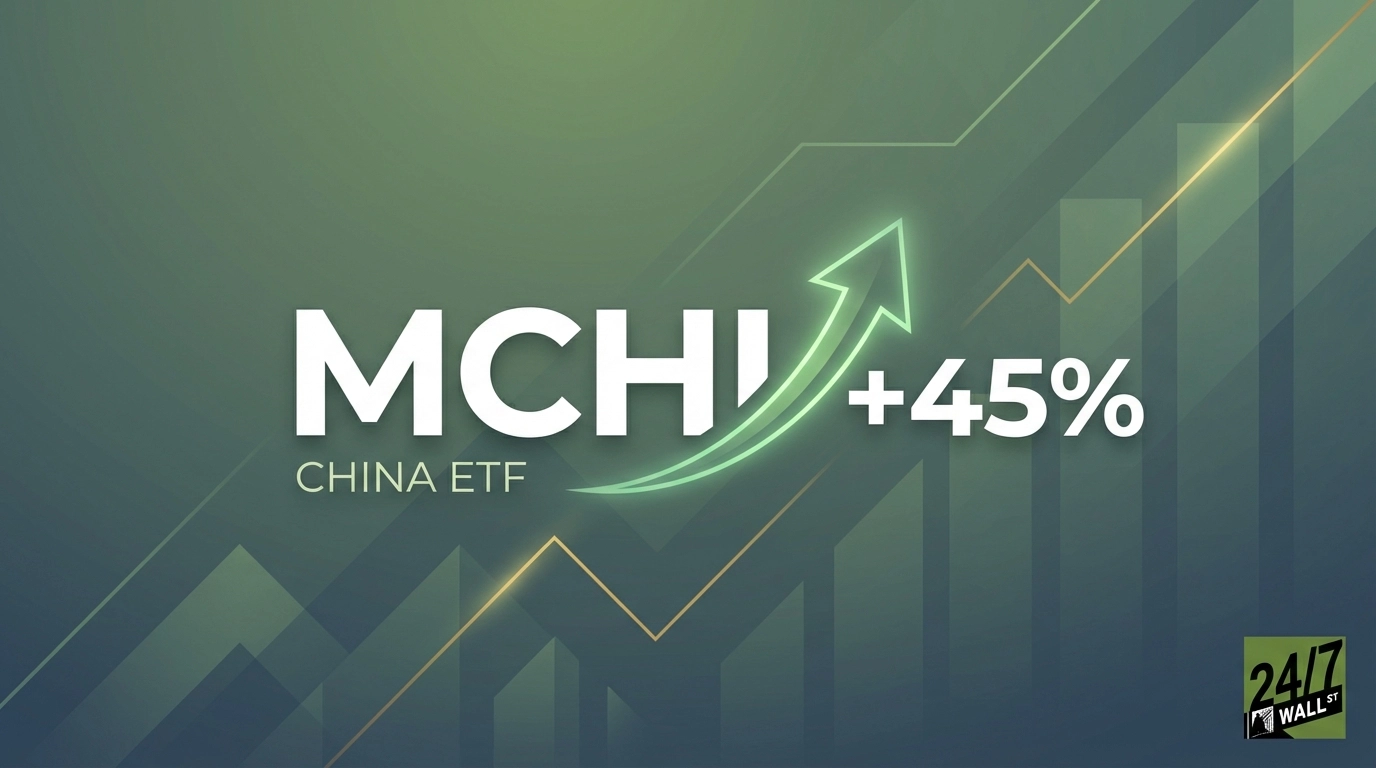
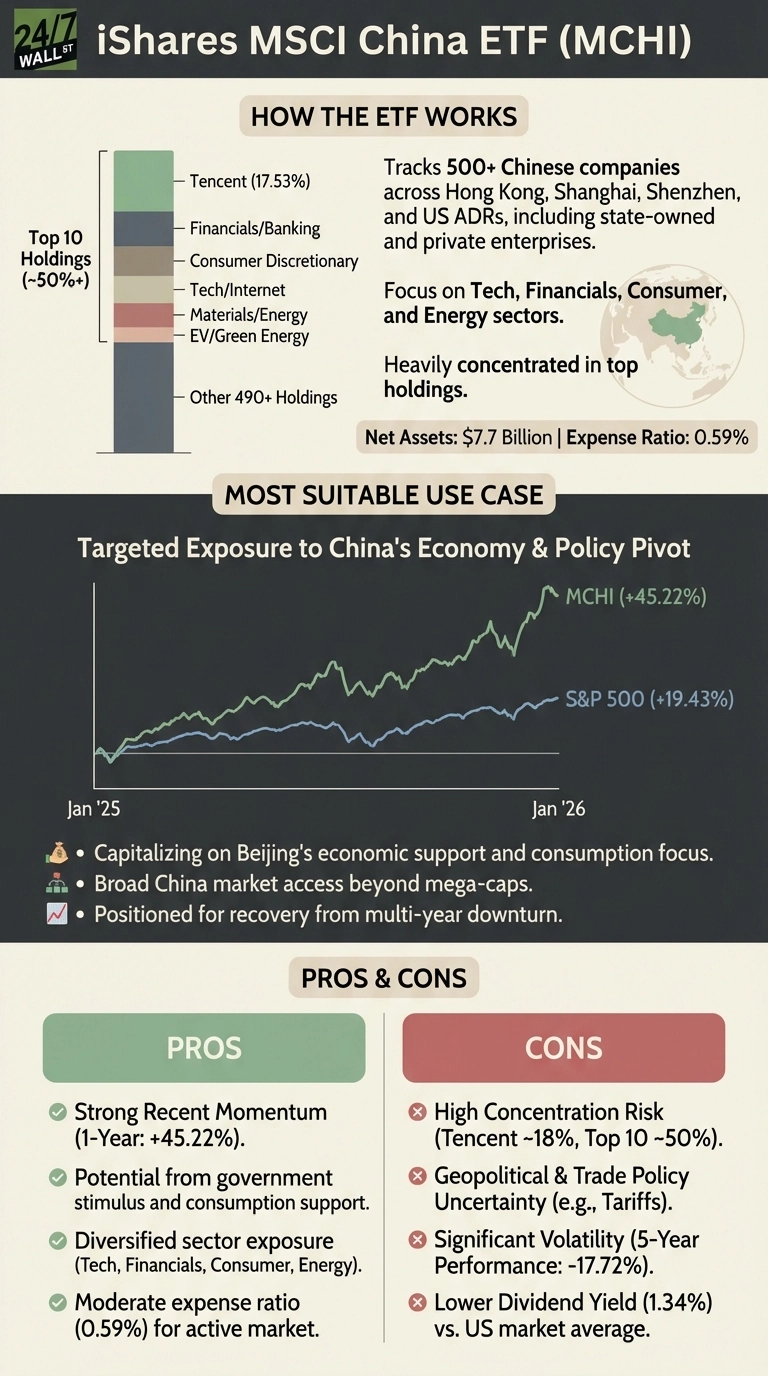
The iShares MSCI China ETF (NYSEARCA:MCHI) has climbed 45% over the past year, crushing the S&P 500’s 19% gain by more than double. Chinese equities are emerging from a brutal multi-year downturn, and the combination of policy support and stabilizing fundamentals suggests this recovery has room to run.

MCHI’s $7.7 billion portfolio tracks over 500 Chinese companies, but Tencent dominates with a 17.5% weighting. This concentration means the fund’s performance hinges largely on China’s gaming and social media giant, which has rebounded strongly as regulatory pressure eases. The remaining holdings blend traditional state banks with consumer internet disruptors like Meituan and PDD Holdings (NASDAQ:PDD), creating exposure to both China’s old and new economy. The fund charges 0.59% annually.

An infographic titled 'iShares MSCI China ETF (MCHI)' with a dark gray background and light text. It is divided into three main sections: 'HOW THE ETF WORKS', 'MOST SUITABLE USE CASE', and 'PROS & CONS'. The 'HOW THE ETF WORKS' section includes a stacked bar chart labeled 'Top 10 Holdings (~50%+)' showing Tencent (17.53%), Financials/Banking, Consumer Discretionary, Tech/Internet, Materials/Energy, EV/Green Energy, and Other 490+ Holdings. Text describes the ETF tracking 500+ Chinese companies across various sectors, with Net Assets of $7.7 Billion and an Expense Ratio of 0.59%. A small world map highlights China. The 'MOST SUITABLE USE CASE' section features a line graph showing MCHI's performance at +45.22% and the S&P 500 at +19.43% from Jan '25 to Jan '26. Bullet points highlight its suitability for exposure to China's economy, market access, and recovery. The 'PROS & CONS' section lists four pros in a green box, including strong recent momentum (+45.22%) and diversified sector exposure, and four cons in a red box, such as high concentration risk (Tencent ~18%) and geopolitical uncertainty.
24/7 Wall St.
This infographic details the iShares MSCI China ETF (MCHI), outlining its top holdings, recent performance against the S&P 500, and a comprehensive list of its advantages and disadvantages.

Beijing’s Stimulus Pivot Is the Tailwind That Matters

The macro story driving Chinese stocks centers on Beijing’s shift toward more aggressive economic support. The government aims to increase household consumption from 40% to 45% of GDP by 2030, a policy shift that would directly benefit internet and consumer holdings. Early evidence suggests the policy is working—retail sales grew 5% in early 2025, validating that stimulus measures are translating into real consumer activity rather than remaining theoretical.

Watch quarterly GDP reports and monthly retail sales data from China’s National Bureau of Statistics. If consumption data continues strengthening through 2026, it validates the investment case for consumer-exposed holdings like Meituan, Trip.com, and JD.com. If exports weaken under trade pressure, Beijing has signaled it will deploy additional domestic stimulus to defend growth targets, creating a policy backstop for Chinese equities.

Tencent’s Weight Creates Both Opportunity and Risk

The fund’s 17.5% allocation to Tencent means MCHI lives or dies by China’s gaming and social media giant. Investors should monitor Tencent’s quarterly earnings reports, particularly gaming revenue trends and regulatory developments around content approval and data privacy.

The fund’s low 12% portfolio turnover suggests a buy-and-hold approach, which minimizes trading costs but also means the Tencent position isn’t going anywhere. Check iShares’ monthly fact sheets and holdings files to track any meaningful shifts in sector allocation or top holdings concentration.

Consider KWEB for Pure Internet Exposure

The KraneShares CSI China Internet ETF (NYSEARCA:KWEB) offers a more focused alternative with $7.9 billion in assets and a 0.70% expense ratio. It concentrates purely on Chinese internet and e-commerce companies, providing a more targeted bet for investors who believe China’s consumer internet recovery will outpace the broader economy. Its top holdings overlap with MCHI—including Tencent, Alibaba, PDD, and Meituan—but without the financial sector and state-owned enterprise exposure.

The Bottom Line

Watch Beijing’s commitment to consumption stimulus and Tencent’s earnings trajectory. Those two factors will determine whether MCHI’s 45% run extends into 2026 or stalls out.

Photo of Michael Williams
About the Author Michael Williams →

I am a long time investor and student of business, and believe finding good companies that can become great investments is the best game on earth. After 20 years of writing and researching the public markets it is clear that individuals have never had more tools and information to take control of their financial lives. From ETFs and $0 commissions to cryptos and prediction markets there has never been a greater democratization of access to investing. 

I write to help people understand the investments available to them so they can make the best choice for their portfolio, whether they're starting out or looking for income in retirement. 

Featured Reads

Our top personal finance-related articles today. Your wallet will thank you later.

Continue Reading

Top Gaining Stocks

APA
APA Vol: 23,883,496
+$1.05
+2.76%
$39.11
Aon
AON Vol: 2,408,528
+$8.64
+2.73%
$325.63
TTD Vol: 24,213,212
+$0.60
+2.55%
$24.11
AJG Vol: 3,845,140
+$5.14
+2.45%
$214.82
PSKY Vol: 23,894,119
+$0.19
+2.12%
$9.15

Top Losing Stocks

SMCI Vol: 243,039,023
-$10.26
33.32%
$20.53
VST Vol: 11,108,700
-$21.35
12.76%
$146.02
CEG Vol: 6,237,209
-$34.48
10.90%
$281.99
MOS Vol: 21,771,381
-$2.61
9.96%
$23.59
NRG Vol: 4,160,964
-$15.60
9.67%
$145.80