Retirees Are Realizing A $1 Million Nest Egg at 62 Only Means $29,630 in Real Spending Power
Retiring at 62 with $1 million sounds comfortable, but the financial landscape has shifted dramatically over the past decade. What worked in 2016 faces different challenges today, from inflation to interest rate swings to healthcare costs before Medicare. The Scenario…

This post may contain links from our sponsors and affiliates, and Flywheel Publishing may receive compensation for actions taken through them.

Retiring at 62 with $1 million sounds comfortable, but the financial landscape has shifted dramatically over the past decade. Inflation, interest rate volatility, and healthcare costs before Medicare have all compounded into a far harder problem than most savers anticipate. A well-padded account balance alone cannot solve it.
The Scenario at a Glance
- Age: 62 (earliest Social Security claiming age)
- Portfolio: $1 million in retirement savings
- Gap years: 3 years until Medicare eligibility at 65
- Social Security penalty: 30% permanent reduction for claiming at 62 vs. full retirement age of 67
- Key concern: Making savings last 25 to 30 years amid rising costs
Online retirement planning communities frequently highlight a striking contrast: someone retiring at 42 with $1.26 million faces a very different calculus than someone doing so at 62 with the same portfolio. The 62-year-old must immediately bridge the gap to both Social Security and Medicare while spending down principal, leaving far less margin for error.
The Purchasing Power Problem
Bureau of Labor Statistics data show that $1 in 2016 now requires approximately $1.35 to buy the same goods in 2026, representing roughly 35% cumulative inflation over a decade. For a retiree following the traditional 4% withdrawal rule, a $40,000 annual withdrawal from $1 million today carries the purchasing power of just $29,630 in 2016 dollars. That erosion is not abstract. It shows up in grocery bills, utility costs, and especially healthcare premiums.
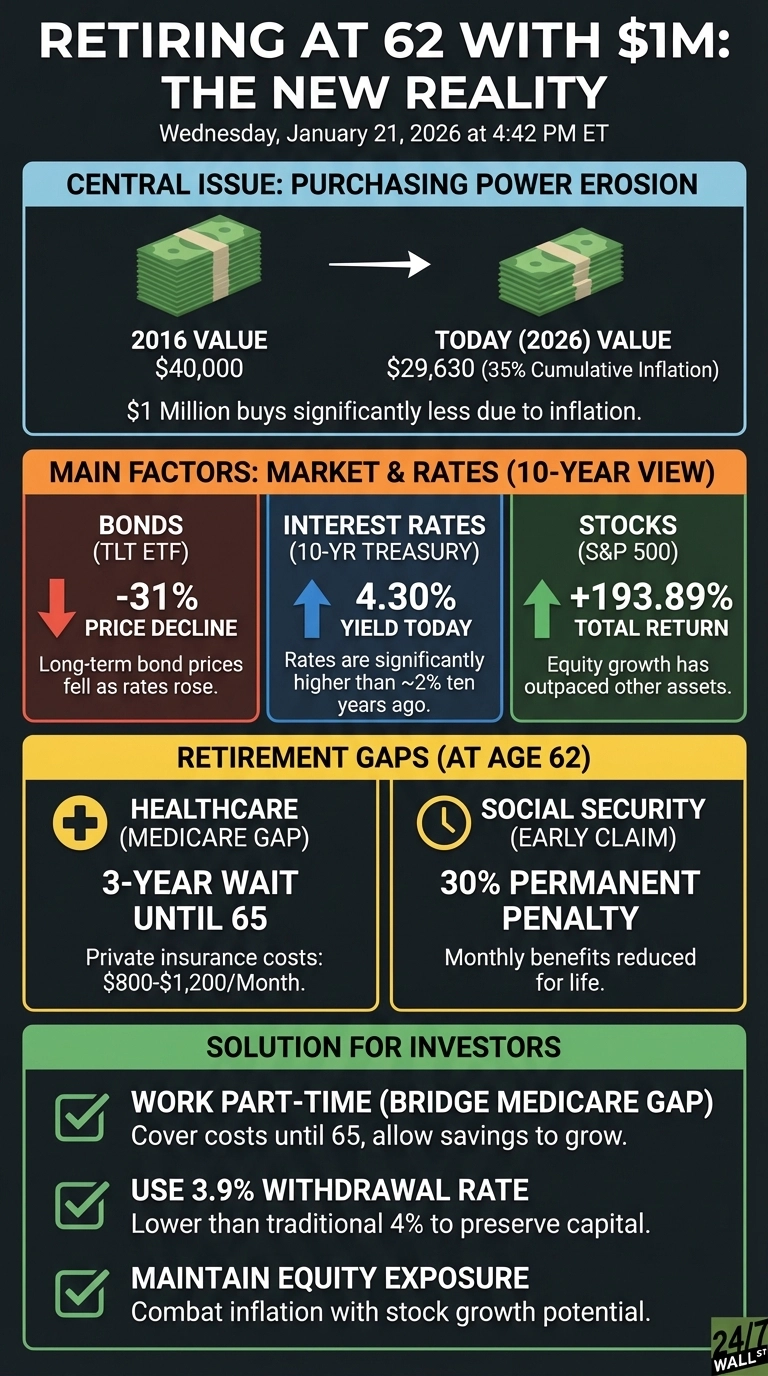
Morningstar’s 2026 State of Retirement Income report recommends a 3.9% starting withdrawal rate for retirees using a fixed spending strategy, translating to $39,000 annually from a $1 million portfolio. Notably, that rate applies to portfolios holding 30% to 50% in equities, not a standard 60/40 split, because heavier equity allocations introduce sequence-of-returns risk that undermines the math. Retirees who adopt a flexible, market-responsive approach may be able to withdraw as much as 5.7% annually, though that strategy requires accepting real spending cuts in down years.
The Interest Rate Reversal
Ten years ago, the 10-year Treasury yielded around 2%. By late September 2026, that yield had climbed to approximately 4.97%, driven by persistent inflation and a Federal Reserve that raised rates in September 2026 for the first time since 2023. Fed Chair Warsh reaffirmed the central bank’s commitment to price stability at that meeting, reinforcing a higher-for-longer posture that directly affects retirees building new fixed-income positions.
Higher yields benefit income-focused retirees assembling fresh bond allocations today. Those who locked in at lower rates during the 2020 and 2021 era faced severe mark-to-market losses as rates climbed. The iShares 20+ Year Treasury Bond ETF fell sharply over the past decade as rates climbed, while the S&P 500 gained roughly 194% during the same period. That divergence illustrates why retreating too far into long-duration bonds too early in retirement carries a steep cost, a lesson retirees who repositioned aggressively in 2022 are still absorbing.
The Sequence of Returns Danger Zone
Retiring at 62 creates acute vulnerability to early market downturns, a dynamic known as sequence of returns risk. Withdrawing fixed amounts from a portfolio during a bear market in the first few years of retirement locks in capital losses and can permanently impair the longevity of a $1 million nest egg. The practical antidote is a dedicated cash or short-duration buffer of one to two years of living expenses, held in Treasury bills or money market funds. That reserve reduces the need to sell equities at depressed prices during corrections, preserving more of the portfolio’s long-term growth engine.
What Actually Matters Now
At 62, a retiree is potentially funding three decades of spending with no Medicare coverage and reduced Social Security benefits. Healthcare is the most immediate financial pressure. The standard Medicare Part B premium is $202.90 monthly in 2026, an increase of nearly 10% from $185.00 in 2025. Private insurance for a 62-year-old can run $800 to $1,200 monthly depending on location and health status, translating to $9,600 to $14,400 annually before the annual Part B deductible of $283 or any additional out-of-pocket costs.
Claiming Social Security at 62 triggers a permanent 30% benefit reduction relative to the full retirement age of 67. The Social Security Administration sets the maximum monthly benefit at $2,969 for those claiming at 62 in 2026, compared to $4,152 at full retirement age. For someone entitled to $1,000 monthly at full retirement age, early claiming means accepting $700 instead, a shortfall that accumulates to roughly $90,000 in forgone benefits over 25 years.
Strategic Paths Forward
Working part-time until 65 eliminates the healthcare coverage gap and allows Social Security benefits to grow 8% annually for each year of delay past full retirement age, up through age 70. Even modest earnings of $20,000 to $30,000 yearly can substantially reduce portfolio withdrawals during the most critical early-retirement years, when sequence risk is highest and a single bad market run can cause lasting damage to portfolio longevity.
For those stopping work entirely at 62, managing tax brackets and withdrawal ordering becomes vital. Drawing from taxable brokerage accounts first, before tapping tax-deferred retirement accounts, can keep Modified Adjusted Gross Income low enough to qualify for Affordable Care Act premium subsidies before Medicare kicks in at 65. Even a few hundred dollars of monthly savings on premiums compounds meaningfully across a three-year Medicare gap.
Maintaining meaningful equity exposure also matters, despite legitimate volatility concerns. A 60/40 stock-to-bond allocation historically supports longer retirement horizons better than conservative portfolios that struggle to outpace inflation. The Bureau of Labor Statistics reported a 12-month CPI rate of 3.4% through August 2026, holding steady from July and down from the 3.5% reading in June. The trend is gradual and the near-term outlook remains uncertain, particularly given rising energy prices and ongoing Middle East tensions that contributed to August’s 0.4% monthly increase.
The Options Income Alternative
For retirees whose required spending exceeds the $39,000 baseline from a 3.9% withdrawal rate, conservative options strategies can serve as a supplemental cash flow source. Writing out-of-the-money covered calls on core equity positions, or selling cash-secured puts on index funds, can generate an additional 2% to 4% in annual yield from an existing stock portfolio. This approach reduces the need to liquidate core holdings to meet living expenses, preserving more of the portfolio’s long-term growth capacity.
What to Do First
Start by calculating your true annual spending need, including healthcare. If it exceeds $39,000 to $40,000 from the portfolio alone, delaying retirement or building additional income sources deserves serious consideration. When running long-term projections, use at least 3% annual inflation as the planning baseline. The BLS August 2026 CPI reading of 3.4% sits well above the historical 2% average, and recent energy price surges keep the near-term outlook uncertain.
A portfolio that cannot grow above inflation at 62 will steadily lose purchasing power across a 30-year retirement. That makes sustained equity exposure a practical necessity rather than a preference to revisit every time markets turn volatile.
Editor’s note: This pass corrects the maximum Social Security benefit at full retirement age from $4,207 to $4,152, per Social Security Administration data; updates the 10-year Treasury yield to approximately 4.97% as of late September 2026 and adds context about the Federal Reserve’s September 2026 rate hike; refreshes the headline CPI figure to 3.4% for the 12 months through August 2026 per the BLS release dated September 11, 2026; and adds Morningstar’s clarification that its 3.9% withdrawal rate applies to portfolios holding 30% to 50% equities.
Contact [email protected] for any questions or corrections.
Austin Smith is a financial publisher with over two decades of experience as an investor, analyst, and advisor. He covers stocks, ETFs, Artificial intelligence and personal finance for 24/7 Wall St. Previously, he spent over a decade at The Motley Fool as a senior editor for Fool.com, portfolio advisor for Millionacres, and launched The Ascent to help reader take control of their personal finances.
His work has been featured on Fool.com, NPR, CNBC, USA Today, Yahoo Finance, MSN, AOL, Marketwatch, and many other publications. He is as an advisor to private companies, and co-hosts The AI Investor Podcast with Eric Bleeker.
When not looking for investment opportunities, he can be found skiing, running, or playing soccer with his children. Learn more about Austin's investment approach here.