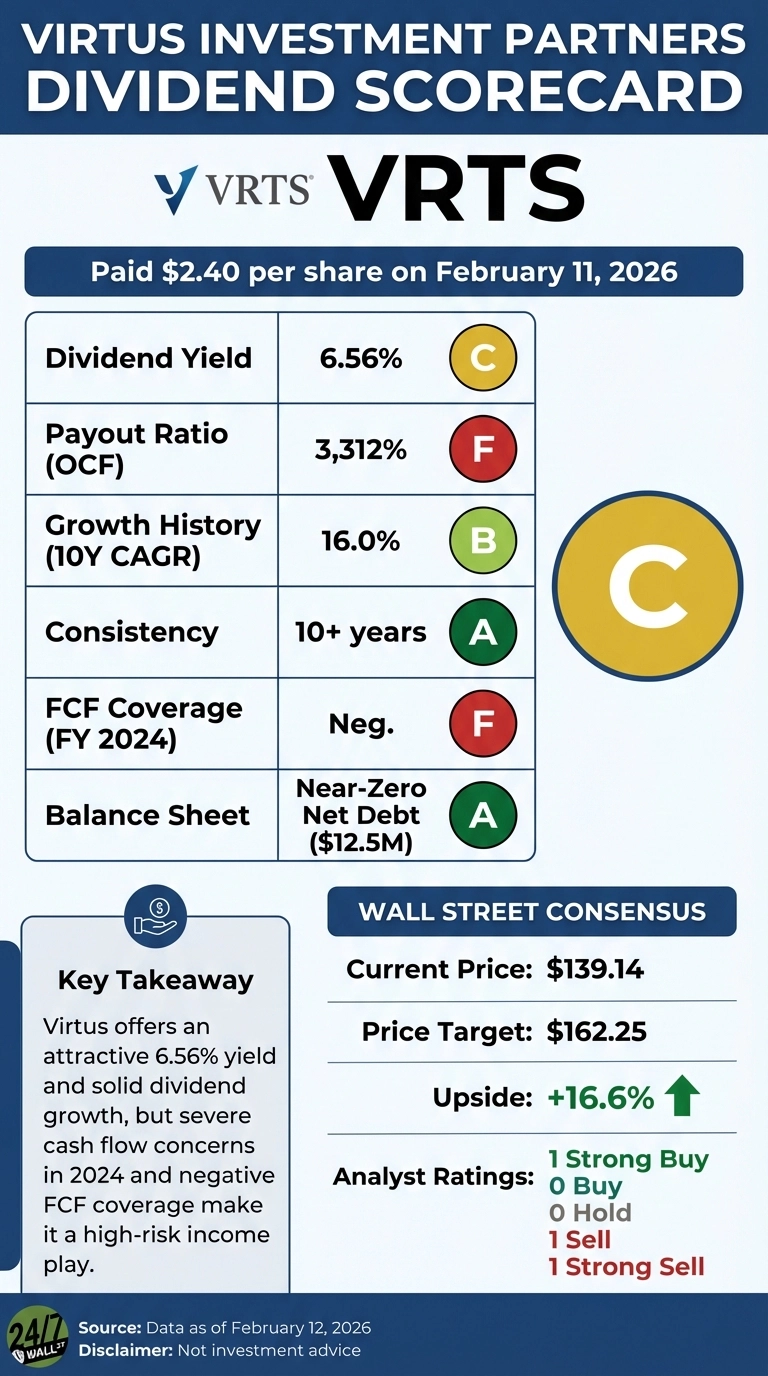
Virtus Investment Partners just paid shareholders $2.40 per share on February 11, 2026, continuing a decade-long streak of quarterly distributions. But beneath the surface of this 6.56% yield, a troubling cash flow picture raises questions about how long the asset manager can sustain its aggressive payout and buyback strategy.
Dividend Growth Meets Cash Flow Reality
The quarterly dividend of $2.40 represents a 6.7% increase from the $2.25 paid in Q3 2025, extending a pattern where Virtus typically raises its payout in the fourth quarter. Over the past decade, the company has grown its quarterly dividend from $0.45 in 2014 to $2.40 today, a compound annual growth rate near 16%.
That growth trajectory looks impressive until you examine what’s funding it. In fiscal 2024, Virtus generated just $1.8 million in operating cash flow, a stunning 99.3% collapse from $237.2 million the prior year. Meanwhile, the company paid out $58.1 million in dividends, creating a payout ratio exceeding 3,000% based on operating cash flow.
The Numbers Behind the Grade
At the current stock price of $139.14, Virtus offers a trailing yield of 6.56%, nearly triple the asset management industry average. BlackRock, the sector’s dominant player, yields just 1.92% by comparison. That spread signals either exceptional value or elevated risk.
The company’s trailing P/E of 7.1x and forward P/E of 7.66x suggest the market is pricing in significant headwinds. Net income of $152.5 million in fiscal 2024 translates to a dividend payout ratio of 38% on an earnings basis, which appears sustainable. But earnings and cash are not the same thing, and for dividend investors, cash is what matters.
Business Pressures Mounting
The cash flow collapse reflects mounting operational challenges. Assets under management fell 9% year-over-year to $159.5 billion, driven by $8.1 billion in net outflows during Q4 2025. Large-cap growth and small/mid-cap equity strategies faced particularly heavy redemptions from both institutional and retail clients.
Revenue declined 11% to $208.0 million in Q4, and while the company beat revenue estimates, it missed adjusted EPS expectations of $6.60, reporting $6.50. Operating margins compressed to 19.1% as fee income declined faster than the company could cut expenses.
The stock has suffered accordingly. Shares are down 20.3% over the past year and 35.5% over five years, though the 10-year return remains positive at 106%.
Capital Allocation Under Scrutiny
What makes the dividend sustainability question more pressing is Virtus’s simultaneous commitment to share buybacks. The company repurchased 60,292 shares for $10 million in Q4 2025, and spent $50 million on buybacks in the first nine months of 2025. Add in a $40 million minority investment in Crescent Cove, and total capital deployment far exceeded what operations generated.
The company is bridging the gap through financing activities. In fiscal 2024, Virtus recorded $74.9 million in positive cash flow from financing, essentially borrowing to fund shareholder returns. While the balance sheet remains strong with $386.5 million in cash and near-zero net debt of $12.5 million, this approach is not sustainable indefinitely.
Recent Quarters Show Improvement
There are signs of stabilization. Operating cash flow recovered to $108.3 million in Q3 2025 and $75.8 million in Q2 2025, providing 7.0x and 4.8x dividend coverage respectively. If this trend continues, the full-year 2025 cash flow picture should look considerably better than 2024’s anomaly.
The ETF business provided a bright spot with $600 million in positive net flows, suggesting some product lines are resonating despite broader outflows. And the company maintains a 16.2% profit margin with return on equity of 13.4%, indicating the underlying business remains profitable even under pressure.
The Verdict
Virtus Investment Partners earns a C grade for dividend quality. The 6.56% yield is attractive, and the 10-year growth record demonstrates management’s commitment to returning capital. But the fiscal 2024 cash flow crisis, combined with ongoing asset outflows and margin compression, raises legitimate sustainability concerns.
The dividend appears covered by earnings at a 38% payout ratio, but the disconnect between net income and operating cash flow is a red flag. Recent quarterly improvements suggest 2024 may have been an outlier, but until Virtus demonstrates consistent cash generation that comfortably exceeds both dividends and buybacks, investors should view this high yield with appropriate caution.
For income investors willing to accept elevated risk in exchange for a 6.56% yield, Virtus offers value at $139.14. But those seeking rock-solid dividend safety should wait for clearer evidence that operating cash flow has stabilized above the $200 million annual level needed to comfortably support current capital allocation priorities.
Contact [email protected] for any questions or corrections.