


PANW Down 5.6% After Earnings. What You Need to Know

Live Blog Update #7 Published
← Back to Full Coverage: Live: Will Palo Alto (PANW) Beat Q2 Earnings Tonight?
Palo Alto’s quarter highlights a familiar tension: the fundamentals are accelerating, but the story has become more complex.
Growth is re-accelerating. Next-Gen ARR is compounding above 30%. Revenue guidance for FY26 stepped meaningfully higher. Free cash flow remains elite. By any operational measure, demand is not the issue.
What is being debated is execution complexity.
CyberArk and Chronosphere materially expand Palo Alto’s footprint in identity and AI-driven security. Strategically, it makes sense. Financially, it enlarges the revenue base. But integration changes the short-term math — particularly around share count, margins, and modeling visibility. That is what the stock is wrestling with, not demand.
The key takeaway: this is no longer just a platformization story. It is now a scale-and-integration story. Investors are asking whether Palo Alto can absorb transformative acquisitions while preserving its margin profile and growth velocity.
If management proves that the 30% margin framework survives this integration cycle, the valuation can hold. If integration friction creeps into operating leverage, volatility will persist.
Contact [email protected] for any questions or corrections.
All Updates from Live Coverage
 Live
Live
Palo Alto Networks beat on both lines—revenue up 15% to $2.6B and non-GAAP EPS of $1.03 versus the $0.96 estimate—yet the stock sits down 2.15%. The disconnect is about optics, not execution.
The EPS Mirage in Q3
Q3 guidance calls for $0.78–$0.80 EPS despite revenue jumping 28%–29% year-over-year. The culprit: higher share count from recent acquisitions. Investors see sequential EPS compression and react, even as the business accelerates.
Valuation Still Commands a Premium
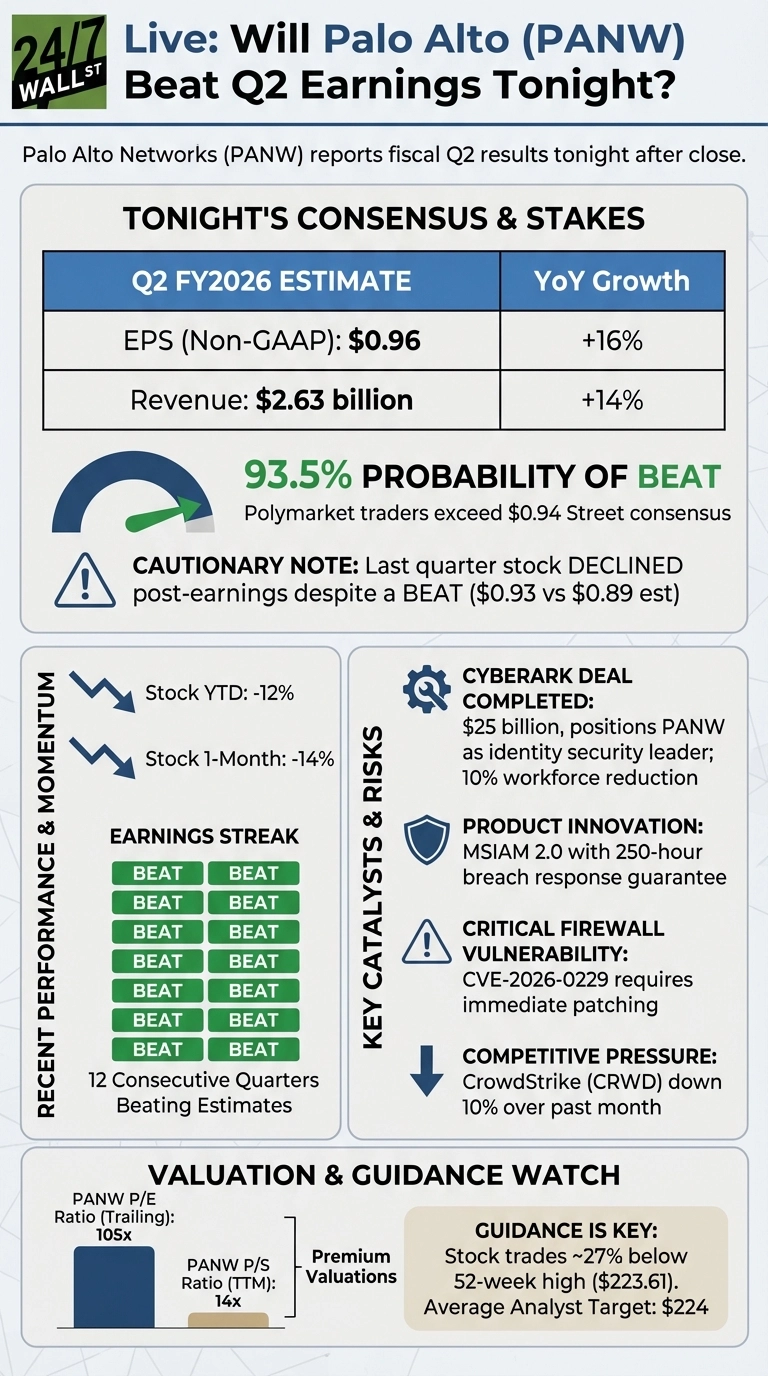
At 105x trailing earnings and 14x sales, Palo Alto trades at a steep premium. When guidance creates optical friction, high-multiple stocks give ground quickly—especially when CrowdStrike is down 9.5% over the past month and Zscaler has dropped 19%.
The Verdict
Short-term traders fixate on Q3 EPS optics while ignoring 33% Next-Gen ARR growth and a full-year revenue guide of $11.28B–$11.31B. This stock trades the shape of near-term numbers, not business trajectory.
Live
Subscription and support revenue continues to drive the majority of growth, reinforcing the recurring model strength.
| KPI | Result | Why It Matters |
|---|---|---|
| Next-Gen Security ARR | $6.3B (+33%) | Core growth engine intact |
| RPO | $16.0B (+23%) | Multi-year visibility improving |
| Non-GAAP Op Margin | 30.3% | Margin discipline holding |
| FY26 FCF Margin Guide | 37% | Cash profile remains elite |
What Changed This Quarter
-
FY26 revenue outlook stepped meaningfully higher.
-
ARR growth guidance signals >50% expansion.
-
Share count in guidance increased significantly, altering EPS optics.
-
The narrative has shifted from “platformization acceleration” to “integration execution.”
Live
CEO Nikesh Arora emphasized accelerating platformization driven by AI modernization and strong adoption of AI security.
CFO Dipak Golechha highlighted the third consecutive quarter of 30%+ non-GAAP operating margins and said the same operational discipline will now be applied to CyberArk and Chronosphere.
Live
Two likely reasons:
-
EPS optics in Q3 — despite explosive revenue growth, the Q3 EPS guide looks compressed due to a materially higher assumed share count.
-
Integration risk now dominates the story — CyberArk and Chronosphere integration execution is the swing factor for the next two quarters.
Live
Q3 FY26 Outlook
-
Revenue: $2.941B–$2.945B (+28%–29% YoY)
-
Next-Gen ARR: $7.94B–$7.96B (+56% YoY)
-
RPO: $17.85B–$17.95B (+32%–33% YoY)
-
Non-GAAP EPS: $0.78–$0.80
-
Shares assumed: 812M–817M
FY26 Outlook
-
Revenue: $11.28B–$11.31B (+22%–23% YoY)
-
Next-Gen ARR: $8.52B–$8.62B (+53%–54% YoY)
-
RPO: $20.2B–$20.3B (+28% YoY)
-
Non-GAAP Op Margin: 28.5%–29.0%
-
Non-GAAP EPS: $3.65–$3.70
-
Adjusted FCF Margin: 37%
The revenue guide is significantly higher than pre-earnings expectations around the $10.5B range for FY26. Growth is clearly accelerating.
Live
Headline numbers are strong, but the stock is trading the shape of guidance and the EPS mechanics. The stock initially jumped before settling down 2.15%
What the quarter actually looked like
-
Revenue +15% YoY to $2.6B
-
Next-Gen Security ARR +33% YoY to $6.3B
-
RPO +23% YoY to $16.0B
-
Non-GAAP EPS $1.03 (vs $0.81 YoY)
-
Non-GAAP operating margin 30.3% (third straight quarter 30%+)
If this were only about execution, the stock would be up.
| Metric | Reported | YoY | Verdict |
|---|---|---|---|
| Revenue | $2.6B | +15% | ✅ Beat vs $2.63B est range |
| Non-GAAP EPS | $1.03 | vs $0.81 LY | ✅ Beat vs $0.96 est |
| Next-Gen Security ARR | $6.3B | +33% | Strong |
| RPO | $16.0B | +23% | Strong |
| Non-GAAP Op Margin | 30.3% | 3rd straight 30%+ | Stable |



Joel South covers large-cap stocks, dividend investing, and major market trends, with a focus on earnings analysis, valuation, and turning complex data into actionable insights for investors.
He brings more than 15 years of experience as an investor and financial journalist, including 12 years at The Motley Fool, where he served as an investment analyst, Bureau Chief, and later led the Fool.com investing news desk. He has also co-hosted an investing podcast and appeared across TV and radio discussing market trends.










 Top Gaining Stocks
 Top Losing Stocks