Marathon Petroleum (NYSE: MPC | MPC Price Prediction) and Phillips 66 (NYSE: PSX) just reported fourth-quarter earnings that underscore why refiners are riding the energy sector’s extraordinary run. With the Energy Select Sector SPDR Fund (NYSE: XLE) up 20.22% year-to-date while the S&P 500 sits near flat, independent refiners belong in the conversation alongside upstream producers.
How the Quarter Landed
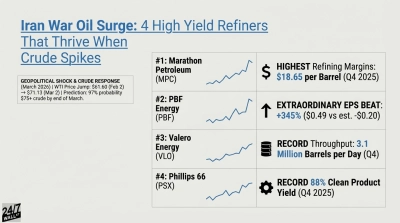
Marathon delivered a $4.07 EPS result that crushed the $2.91 estimate, driven by 95% refining utilization and an $18.65 per barrel refining margin. The company generated $1.535 billion in net income, a huge increase over the $371 million posted in Q4 2024. CEO Maryann Mannen credited “strong refining operational performance and commercial execution” for $8.3 billion in full-year operating cash flow, up 276% year-over-year.
Phillips 66 posted $2.47 adjusted EPS versus the $2.19 estimate, running refineries at 99% crude capacity utilization with a record 88% clean product yield and $2.9 billion in GAAP net income. CEO Mark Lashier called 2025 “a transformative year” after acquiring full ownership of WRB Refining and divesting European retail operations.
| Metric | MPC | PSX |
| Refining Utilization | 95% | 99% |
| Q4 Net Income | $1.535B | $2.9B |
| Free Cash Flow (Full Year) | $6.838B | $2.729B |
Pure Refining vs. Portfolio Diversification
Marathon operates as a pure-play refining and midstream business, concentrating capital on the largest U.S. refining system. The company returned $4.5 billion to shareholders in 2025 through buybacks, with $4.4 billion remaining in authorization. Its 359% five-year return reflects disciplined capital allocation across high-utilization refining assets and strategic midstream investments in the Permian and Marcellus regions.
Phillips 66 spreads risk across refining, midstream, chemicals, and renewable fuels. The company reduced debt by $2.0 billion in 2025 and is expanding internationally with the Lindsey Oil Refinery acquisition in England. Its chemicals segment includes the Golden Triangle Polymers facility in Texas and the Ras Laffan project in Qatar, expected to start up in late 2026. This diversification provides downside protection but dilutes pure refining exposure.
What Matters for Income Investors
Marathon raised its quarterly dividend to $1.00 per share from $0.91, with a 1.93% yield paired with aggressive buybacks.
Phillips 66 offers a higher 3.04% yield after raising its quarterly payout to $1.27 per share for Q1 2026. Its $2.7 billion in 2025 free cash flow covered the $1.9 billion dividend with room to spare, though total shareholder returns exceeded free cash flow when including buybacks.
The Case for Marathon
Marathon’s pure-play focus and superior cash flow stand out. Its $6.8 billion in free cash flow versus Phillips 66’s $2.7 billion demonstrates operating leverage that matters when refining margins compress. Marathon’s 23.3% year-to-date gain outpaces Phillips 66’s 22.6%. Phillips 66 offers a higher yield and chemicals exposure as a hedge against pure refining volatility, while Marathon’s concentrated strategy has produced stronger free cash flow and year-to-date price performance through early 2026.
Contact [email protected] for any questions or corrections.