Live coverage has ended. The full story is below.
Markets are mixed, as investors monitor war developments.
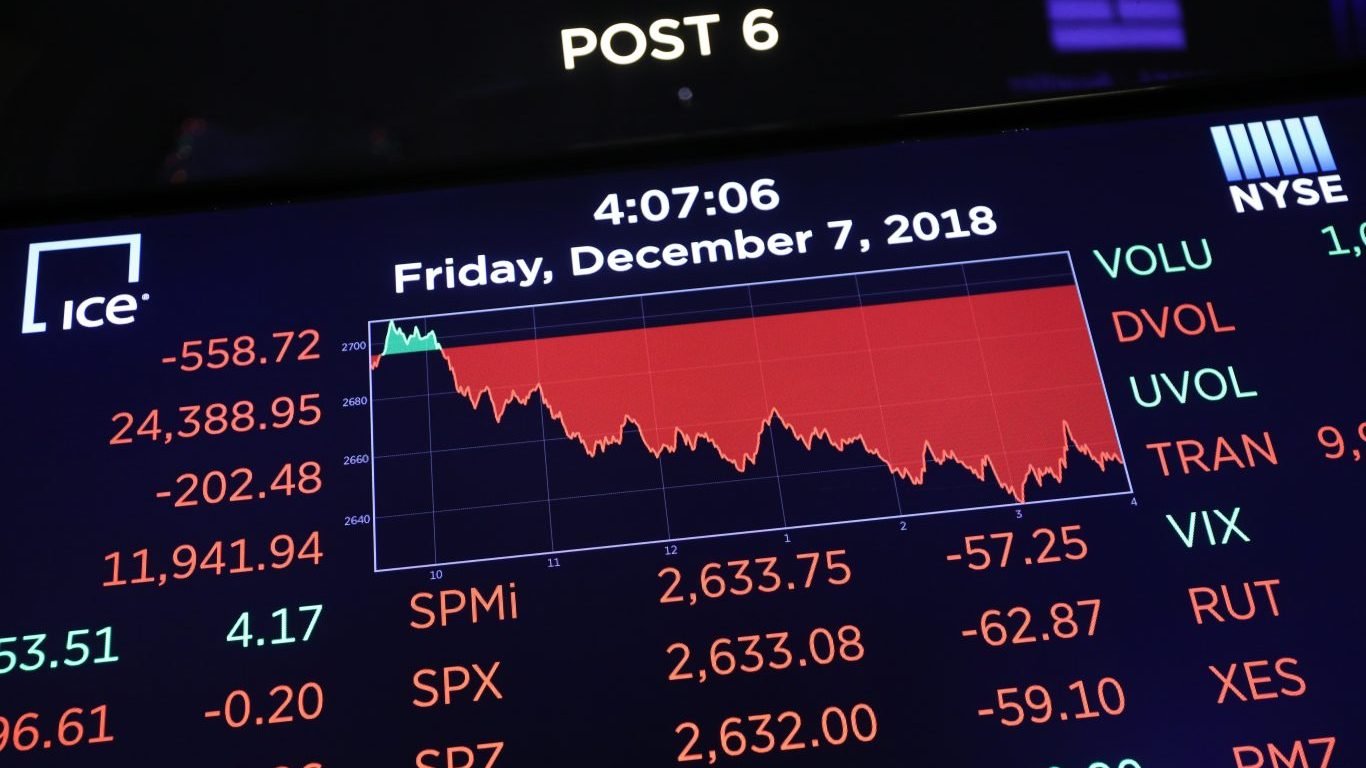
At the moment, the S&P 500 is up about 0.04%, or by two points. The SPDR S&P 500 ETF (SPY) is down about 0.9%. The Dow is down about 0.02%, or by 12 points. The NASDAQ is up about 0.08%, or by 19 points. Oil is up slightly at $74.68. Gold prices are up $50 at $5,162.
And Bitcoin is back above $71,000, with a gain of $2,793 – especially with rising odds for the passage of the Clarity Act, which is aimed at legalizing stablecoins.
“We are in the headline-watching business at the moment, with competing stories shifting market sentiment an hourly basis yesterday,” added Deutsche Bank’s Jim Reid, as quoted by CNBC. “From a market perspective, the main issue is that there’s no sign of either side de-escalating, and if anything, it looks as though things are still ratcheting up.”
$100 Oil is Still a Strong Possibility
That’s because 1) war with Iran may last a while, 2) Oil could soar to $100 barrel with Strait of Hormuz traffic halted.
Remember, the Strait is a critical transit route for global oil, with about 13 million barrels of oil per day moving through that region. By disrupting that flow, we risk $100 oil.
If ships aren’t allowed through, oil would easily gush higher. In fact, “This could present a scenario three times the severity of the Arab oil embargo and Iranian revolution in the 1970s, and drive oil prices into the triple digits, while LNG prices retest the record highs of 2022,” added Saul Kavonic, head of energy research at MST Marquee, as quoted by CNBC.
And three, President Trump told CNN, “We haven’t even started hitting them hard. The big wave hasn’t even happened. The big one is coming soon.”
3 Energy ETFs to Keep An Eye On
While you can always invest in oil giants like Exxon and Chevron, you can diversify at a lower cost with exchange-traded funds (ETFs), such as:
SPDR Energy Select Sector ETF (XLE)
With an expense ratio of 0.09%, the XLE ETF provides exposure to companies in the oil, gas, and consumable fuel, energy equipment, and services industries, as noted by State Street SPDR. Since the start of the year, the ETF has run from about $44 to $56.52.
SPDR S&P Oil & Gas Exploration & Production ETF (XOP)
With an expense ratio of 0.35%, the ETF provides exposure to the oil and gas exploration and production segment of the S&P TMI, which comprises the following sub-industries: Integrated Oil & Gas, Oil & Gas Exploration & Production, and Oil & Gas Refining & Marketing, as noted by State Street SPDR. Since the start of the year, the ETF has run from $125 to $159.
iShares Global Energy ETF (IXC)
With an expense ratio of 0.40%, the iShares Global Energy ETF seeks to track the investment results of an index composed of global equities in the energy sector. Some of its 50 holdings include Exxon Mobil, Chevron Corporation, BP PLC, Total SA, and EOG Resources. Since the start of the year, the ETF has run from $42 to $52.25.
Contact [email protected] for any questions or corrections.