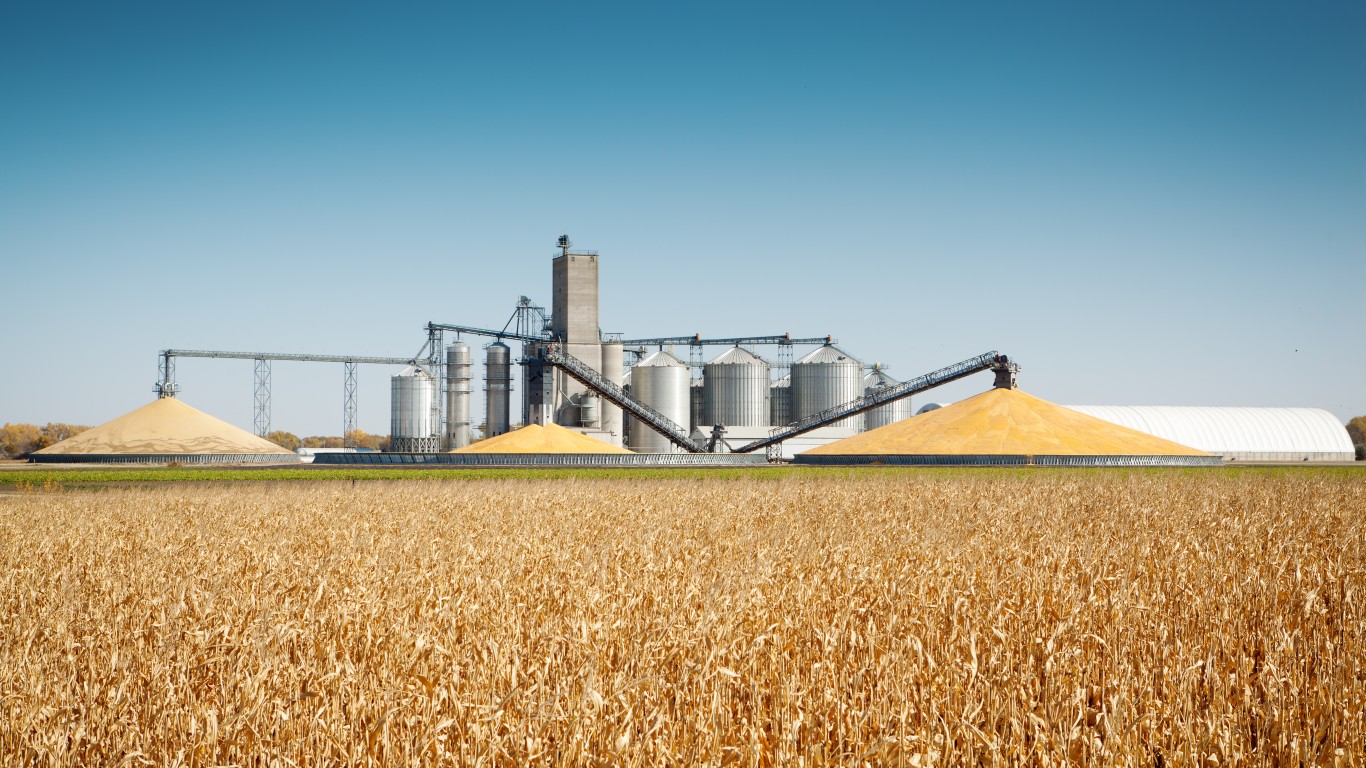
While the S&P 500 has slipped over the past month, a quiet corner of the commodity market has moved in the opposite direction. Teucrium Corn Fund (NYSEARCA:CORN) gained 2.64% over the past month while SPY dropped 1.36%. That divergence is exactly what CORN was designed to deliver: pure exposure to corn prices, completely disconnected from equity market swings.
CORN holds a blend of CBOT corn futures contracts across near-month, second-to-expire, and December delivery dates. That structure reduces over-concentration in a single contract month, which limits but does not eliminate futures roll costs. The fund launched in June 2010 and holds roughly $45 million in net assets, making it a small but functional vehicle for those seeking direct corn price exposure without a futures brokerage account.
The Macro Signal That Moves Corn Prices Most
The single biggest macro driver for CORN is the USDA’s World Agricultural Supply and Demand Estimates report, known as the WASDE. Released monthly by the USDA’s National Agricultural Statistics Service, the WASDE sets global expectations for corn production, consumption, and ending stocks. When the report shows tighter-than-expected supplies, corn futures typically rally sharply in the session following the release.
Weather patterns tied to La Nina and El Nino cycles also shape growing conditions across the U.S. Corn Belt and South America. A drought during the U.S. pollination window, typically July, can sharply reduce yield forecasts and push futures higher. Export demand from China adds another layer: when China steps in as a large buyer, it tightens the U.S. supply picture quickly. WASDE releases are published on the second Tuesday of each month on the USDA website.
The ETF Mechanic That Can Quietly Eat Your Returns
The most important fund-specific factor is roll yield. CORN must periodically sell expiring futures contracts and buy new ones further out on the curve. When the futures curve is in contango, meaning later-dated contracts are priced higher than near-term ones, each roll costs the fund money. The reverse, backwardation, works in the fund’s favor.
Investors can monitor the corn futures curve through the CME Group’s corn futures quotes page, updated daily. When the curve steepens into contango, the fund’s returns tend to lag spot corn price movements. When backwardation develops, CORN tends to outperform its underlying commodity.
What to Watch Over the Next 12 Months
If WASDE reports through mid-2026 show tightening global corn stocks driven by weather disruptions or renewed Chinese buying, corn futures prices could remain elevated. However, persistent contango has historically caused commodity ETFs like CORN to lag spot price movements even in bullish supply environments, meaning fund returns may not fully reflect any commodity price gains.
Contact [email protected] for any questions or corrections.