SCHD gets most of the attention in dividend ETF conversations, and for good reason. Schwab U.S. Dividend Equity ETF (NYSEARCA:SCHD) is a benchmark many compare against. But WisdomTree U.S. MidCap Dividend Fund (NYSEARCA:DON) has quietly put up competitive numbers over the long term while fishing in a completely different part of the market.
How DON Generates Income
DON tracks a dividend-weighted index of mid-cap U.S. stocks, meaning companies are weighted by total dividends paid rather than market cap. The fund passes those dividends to shareholders monthly. With $3.8 billion in assets and a 0.38% expense ratio, it is a well-established vehicle with a 20-year track record dating to June 2006.
The current 2.4% dividend yield trails SCHD’s 3.62%. Investors choosing DON are not choosing it for a higher yield. They are choosing it for mid-cap exposure and a different sector mix.
Where the Income Actually Comes From
DON’s portfolio leans heavily on Financials at 22.3% and Industrials at 17.7%, with meaningful positions in Utilities and Energy. The largest single position sits at just 1.32%, spread across 300-plus names. That diversification is a genuine structural strength. No single company cutting its dividend meaningfully disrupts the fund’s total payout.
The dividend history reflects that stability. DON has paid monthly distributions without interruption since transitioning to a monthly schedule, with 19-plus years of uninterrupted payments including through the 2008 financial crisis and the 2020 pandemic selloff. Year-end special distributions have been a recurring feature, with the December 2025 special reaching $0.23369.
The Performance Picture
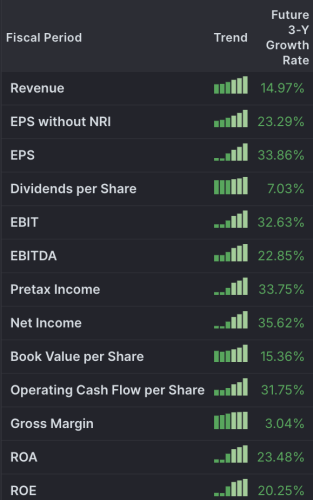
Over five years, DON returned 57.68% on price alone versus SCHD’s 59.49%. Over ten years, SCHD’s 234.05% price return substantially outpaced DON’s 153.73%. The recent rebound in DON’s returns compared to SCHD reflect a rotation from investors into mid cap stocks, and it could be a multi-year tailwind as many large cap stocks trade at lofty multiples. We’ve seen similar rotations into international equities in the last 12 months, driving European markets to outperform the higher growth S&P 500.
Is the Dividend Safe?
The structural case for income sustainability is solid. Deep diversification across 300-plus holdings, a dividend-weighting methodology that naturally selects for cash-generating companies, and nearly two decades of uninterrupted payments all point to a durable income stream. Special year-end distributions fluctuate and should not be treated as guaranteed. The base monthly distributions have been consistent.
SCHD has delivered stronger long-term price appreciation and a higher yield based on the data reviewed. DON’s portfolio is structured differently, with exposure to mid-cap companies that SCHD largely excludes, monthly income distributions, and deep diversification across 300-plus holdings. The two funds serve different segments of the dividend equity market.
Contact [email protected] for any questions or corrections.