2026 has put everyone in a jolt of worry. The ongoing conflict has put markets in heightened volatility, and investors seem spooked. Long-term investors can view it as an opportunity to load up on quality stocks and exchange-traded funds since the dip could be short-term in nature. If we take a broader view of the economy, it is expanding, and corporate earnings are robust.
Hence, if you’re a long-term investor, consider it an opportunity to load up on quality investments. Investors are now moving away from the tech sector and towards value and dividend stocks. Avoid buying individual winners or sectors; instead, buy these three dividend ETFs whenever the market dips. It will ensure steady passive income with an upside potential.
Vanguard Total Stock Market Index Fund ETF
Buying the Vanguard Total Stock Market ETF (NYSEARCA:VTI) will give you an opportunity to make the most of the broader market instead of a specific sector. This will help you avoid losses in case a sector or industry sees a drop. VTI will also give you exposure to mid-caps and small-caps, which could make a comeback this year. It has a yield of 1.10% and an expense ratio of 0.03%. While the yield isn’t extraordinary, it will ensure steady income at low risk.
When the market dips, it is ideal to look for a low-risk opportunity instead of chasing growth. Buying the whole market instead of small segments will reduce downside risks. The passively managed fund tracks the performance of the CRSP US Total Market Index.
It invests in about 3,500 stocks and continues to have the highest allocation to the tech sector at 37.80%, which is followed by consumer discretionary at 13.90% and industrials at 12.50%. Its top 10 holdings include the Magnificent Seven, with the highest weightage of 6.6% to Nvidia. By diversifying across 3,000 stocks, the ETF manages to keep the risk at a minimum.
VTI has generated a total return of 17.05% in a year and 76.79% in 3 years. The ETF gained 21% in the past year and is exchanging hands for $334.
Schwab U.S. Dividend Equity ETF
An excellent dividend ETF from Charles Schwab, the Schwab U.S. Dividend Equity ETF (NYSEARCA:SCHD) has a yield of 3.51%. It tracks the Dow Jones U.S. Dividend 100 Index and invests in stocks that are screened for dividend growth, dividend yield, return on equity, and cash flow. It holds 100 blue-chip stocks that have a history of paying and growing dividends. SCHD reconstitutes the holdings quarterly. Hence, you always own the best dividend stocks in your portfolio.
The fund attracted about $800 million in net inflows last month and has become a favorite of income investors. SCHD has $78.4 billion in assets under management and is one of the largest dividend ETFs in the U.S. The fund has the highest allocation in the energy sector at 19.88%, which is followed by consumer staples at 18.50% and healthcare at 16.20%. It allocates only 8.20% to the technology sector.
SCHD’s top 10 holdings include well-known dividend stocks such as Chevron Corporation, Verizon Communications, Lockheed Martin, Coca-Cola, PepsiCo, and ConocoPhillips. Its dividends have seen a steady rise and went from $0.24 in the first quarter of 2025 to $0.27 per share in the fourth quarter. SCHD has generated an annualized return of 15.67% in 1 year and 12.66% in 3 years.
Exchanging hands for $31, the ETF has gained 11.86% year to date, outpacing the S&P 500 and Nasdaq 100.
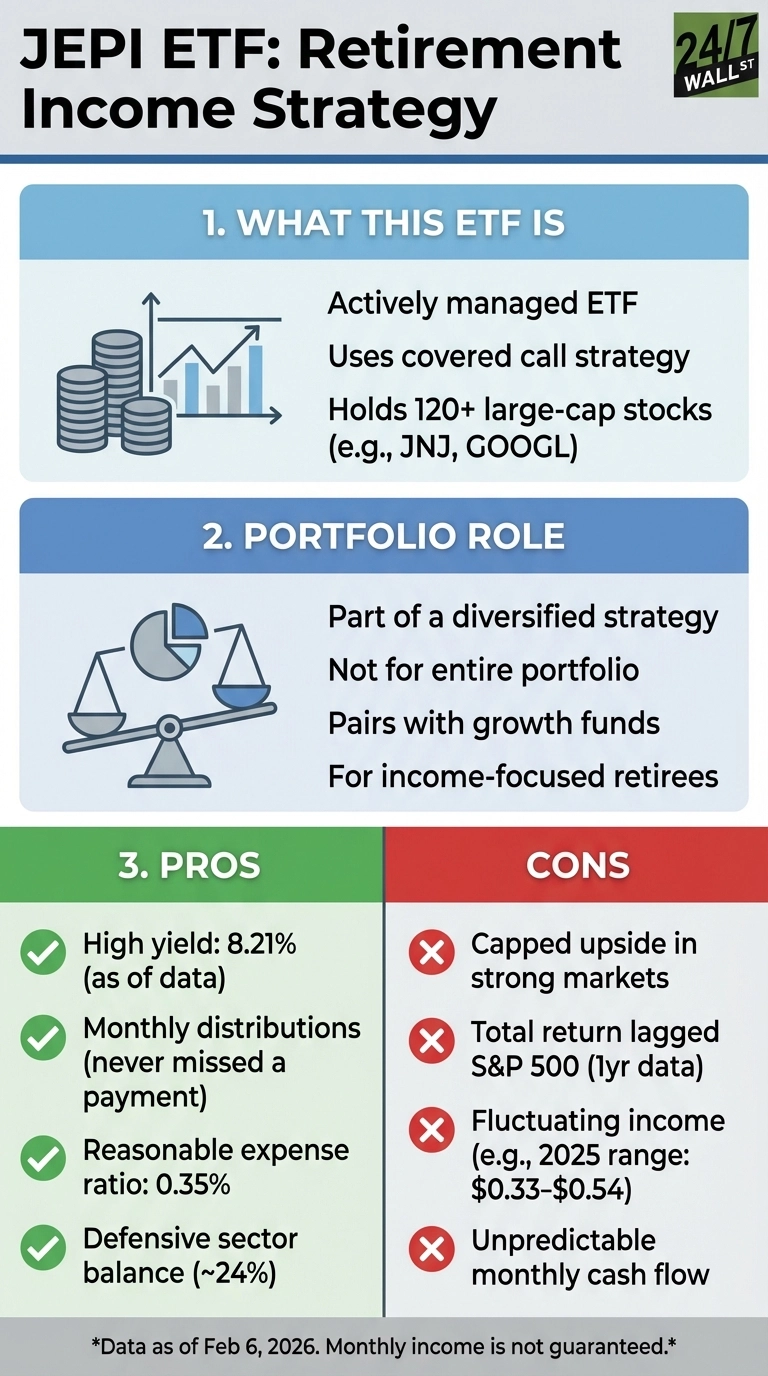
JPMorgan Equity Premium Income ETF
The JPMorgan Equity Premium Income ETF (NYSEARCA:JEPI) has a unique strategy that generates steady monthly income for investors. The fund managers use a bottom-up fundamental research process to select stocks. This ensures the best blue-chip stocks are a part of the portfolio. At the next step, the manager writes out-of-the-money call options that generate a premium and ensure a steady monthly dividend.
JEPI has a yield of 7.56%. The fund has generated a cumulative 1-year return of 9.55% and a 3-year return of 41.39%. It has the highest allocation in the technology sector at 14.9%, which is followed by healthcare at 12.5% and industrials at 12.2%. JEPI invests in 124 stocks, and no stock has a weightage higher than 2%. Its top 10 holdings include dividend giants like Johnson & Johnson, AbbVie Inc., NextEra Energy, and PepsiCo.
It recently paid a dividend of $0.35, and while the dividend may fluctuate, it will generate a monthly paycheck. Since JEPI has a high yield, the opportunity for capital appreciation is limited. The fund has only gained 1.7% in the past year and is exchanging hands for $58.38. The trade-off is simple: you enjoy a higher income in exchange for limited market gains. JEPI has an expense ratio of 0.35%, which is reasonable for an actively managed fund.