One of the most notable things to remember is that Trinity Capital (NASDAQ:TRIN) is paying investors $0.17 per share every month, which annualizes to roughly 14% at today’s share price. That yield draws an immediate question: is this income stream built to last, or is it a high-wire act with a shortening rope?
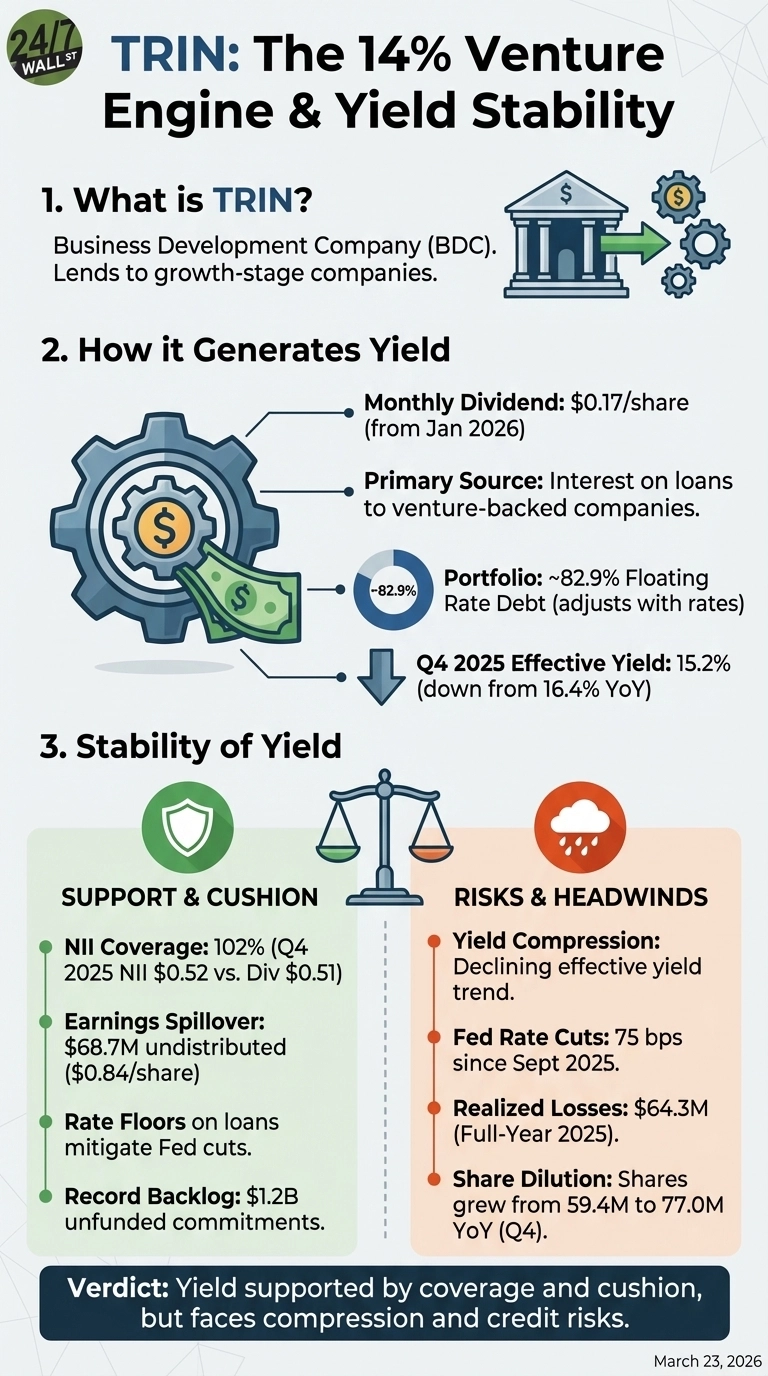
How Trinity Generates Its Yield
Trinity is a Business Development Company, a federally regulated structure that allows it to lend to growth-stage companies and pass the majority of that income to shareholders. Unlike dividend stocks that pay from corporate profits, Trinity earns its distributions primarily from interest on loans to venture-backed and private equity-sponsored businesses across five verticals: tech lending, equipment finance, life sciences, asset-based lending, and sponsor finance.
The mechanics matter, as 82.9% of Trinity’s debt portfolio is floating rate, meaning the interest it collects adjusts with benchmark rates. That has been a tailwind in a high-rate environment, but it cuts the other way when the Fed eases.
The Rate Cut Problem Is Already Showing Up
The Fed has cut rates by 75 basis points since September 2025, and the impact is already visible in Trinity’s income statement. In addition, the effective yield on average debt investments fell from 16.4% a year ago to 15.2% in Q4 2025, and this compression feeds directly into income-generating capacity, making the pace of future Fed cuts one of the most important variables for dividend sustainability.
When it comes to management, their answer is notable as CEO Kyle Brown said on the Q4 earnings call: “Unlike most other lenders, the majority of our loans have interest rate floors set at or near the original levels. So when rates come down, our income does not fall proportionately. In fact, much of the portfolio is already at those floors.” He also noted that rate cuts could accelerate prepayments, generating fees, while simultaneously reducing the cost of Trinity’s own floating-rate borrowings.
Coverage Is Thin but Supported by a Cushion
Net investment income per share came in at $0.52 for Q4 2025 against a $0.51 quarterly dividend, a 102% coverage ratio. That same 102% coverage held across all four quarters of 2025, thin coverage is not inherently alarming for a BDC, but it leaves little room for error if portfolio yields continue to compress or credit losses accelerate.
The more meaningful buffer is the spillover from undistributed earnings. Trinity carried $68.7 million ($0.84 per share) in undistributed taxable income as of December 31, 2025, which represents roughly five months of dividends at the current rate, providing a genuine cushion if NII per share dips.
Credit Risk Is the Bigger Watch Item
Overall, yield compression is manageable, but credit losses are harder to absorb, as Trinity recorded $33.9 million in net realized losses in Q4 alone, bringing the full-year 2025 total to $64.3 million. These losses came primarily from converting or working out distressed-debt positions, not from widespread portfolio deterioration. Non-accrual investments held at 0.7% of the debt portfolio at fair value in Q4, a low and stable figure.
Watch-list investments reached 5.3% of the portfolio in Q2 2025, up from 3.0% sequentially, and that number has not escalated into realized losses at a damaging scale, but it is the metric that would signal early stress if the venture lending environment deteriorates.
Share Dilution Is Compressing Per-Share Growth
Trinity has been aggressively raising equity through its ATM program to fund portfolio growth. Basic weighted average shares outstanding grew from 59.4 million to 77.0 million year-over-year in Q4, even as total NII hit a record $39.9 million. NII per share has stayed flat at $0.52 despite overall income growing substantially. Accretive issuances above NAV are not inherently harmful, but ongoing dilution puts a ceiling on per-share earnings growth unless origination volumes keep pace.
Total Return Context
As of March 23, 2026, TRIN shares are down 0.20% year-to-date and 9.42% over the past year, indicating the 14% yield has not been eroded by meaningful capital losses in recent periods. Since its IPO, TRIN has delivered a cumulative total return of 109%, compared to a peer average of 70% and the S&P 500’s 82%.
Verdict
Trinity’s 14% yield is not a mirage, but it carries real risk, as coverage remains consistently positive and is backed by a meaningful earnings cushion. Interest rate floors provide more insulation from Fed cuts than the floating-rate exposure alone would suggest, and the record $1.2 billion in unfunded commitments provides a deployment runway that supports future income.
Yield compression is ongoing, realized losses have been elevated, and per-share earnings are being diluted by continuous equity issuances. Venture lending to growth-stage borrowers carries episodic credit losses by nature, and investors should understand that dynamic before drawing conclusions about the income stream.