Reality Income vs. AGNC: One of These High-Yield Dividends Could Hurt You
Realty Income (NYSE:O) and AGNC Investment (NASDAQ:AGNC) just posted earnings that sit at opposite ends of the income spectrum. Realty Income raised its payout for the 113th straight quarter and guided to roughly $8 billion in 2026 deals. AGNC swung…


Realty Income (NYSE:O) and AGNC Investment (NASDAQ:AGNC) just posted earnings that sit at opposite ends of the income spectrum. Realty Income raised its payout for the 113th straight quarter and guided to roughly $8 billion in 2026 deals. AGNC swung to a loss as Middle East tensions blew out mortgage spreads. Same REIT label, very different risk profile.
Rent Checks Roll In. Spreads Blow Out.
Realty Income’s Q4 reported in February, with revenue of $1.49 billion beating the $1.17 billion consensus by 27.34%. EPS of $0.32 missed expectations, weighed down by $124.41 million in quarterly impairment provisions. Occupancy held at 98.9% and rent recapture hit 104.9% on re-leased space. Boring, but those are the kind of numbers a monthly check is built on.
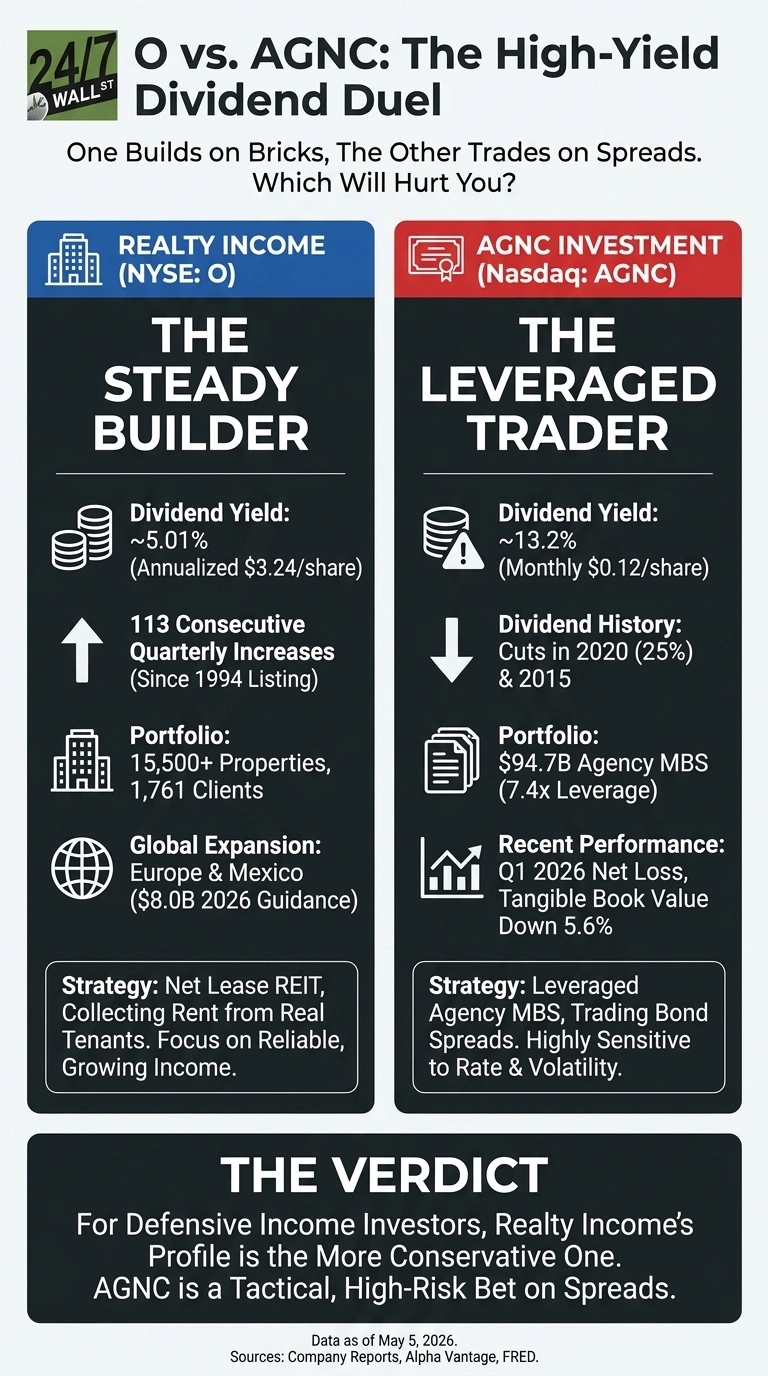
AGNC reported on April 21, 2026 with EPS of -$0.17, a tangible book value of $8.38 (down 5.6%), and a -1.6% economic return on tangible common equity. CEO Peter Federico blamed “the war in Iran and the potential for more widespread conflict in the Middle East” for the spread shock. The bright spot: net spread plus dollar roll income jumped to $0.42 per share from $0.35.
One Owns Buildings. The Other Trades Bond Spreads.
| Lens | Realty Income | AGNC |
| Core Bet | Net lease real estate | Levered Agency MBS |
| Portfolio | 15,500+ properties, 1,761 clients | $94.70 billion in MBS |
| Leverage | Investment grade balance sheet | 7.4x |
| Dividend Track | 133 increases since 1994 | 25% cut in March 2020 |
Realty Income is widening its lane: a $1.5 billion Core Plus Fund, a GIC build-to-suit JV, $950.7 million in Q4 European deals at a 7.2% yield, and a fresh $200 million Mexico entry.
AGNC is doing something different: it pushed swap notional to $76.5 billion, lifted hedge coverage to 83%, and raised $401 million through ATM offerings to defend the book. One company is buying rent streams. The other is managing duration risk in real time.
The Next Move Hinges on Rates and Geopolitics
The 10-year Treasury sat at 4.39% on May 1, in the 82.7 percentile of its trailing year. For Realty Income, that pressures refinancing math, but 2026 AFFO guidance of $4.38 to $4.42 easily covers the $3.240 annualized dividend.
For AGNC, the $1.44 annualized payout is not directly covered by GAAP earnings in down quarters, and tangible book value can swing 5% in 90 days. I will be watching whether spreads tighten back as Iran headlines fade.
Why I Would Take Realty Income’s Boring Yield Over AGNC’s Big One
For me, this is the easier call than the headline yield suggests. Realty Income’s 5.01% yield is backed by 15,500 buildings and a payout that has only ever crept higher.
AGNC’s 13.2% yield is real, but you are renting it from a leveraged spread book that just printed a negative economic return and has cut the dividend twice in the last decade. For defensive income investors, Realty Income’s profile is the more conservative one. If you are a tactical trader who thinks Middle East tensions cool and MBS spreads compress, AGNC’s $11.44 analyst target offers a totally different trade. The dividend alone is a thin reason to own it.
Contact [email protected] for any questions or corrections.
Vandita Jadeja is a financial publisher with over a decade of experience writing about financial topics, including investment, savings, retirement, insurance and banking. Vandita is a Chartered Accountant who loves to debunk financial concepts for readers.
Her work has appeared on sites that include The Motley Fool, InvestorPlace, and Benzinga. She covers investing and focuses on stock picks and price prediction for 24/7 Wall St.
When not looking for the next stock investment opportunity, she can be found traveling, reading, chasing sunsets and enjoying her iced latte.