Treasury Bonds Now Pay More Than Stocks Earn by a Gap Last Seen in 2009. Warren Buffett Warned in 1999 What That Does to Stock Prices

This post may contain links from our sponsors and affiliates, and Flywheel Publishing may receive compensation for actions taken through them.
A 10-year Treasury bond closed Tuesday at a 4.98% yield, and the S&P 500, priced at 26 times its last twelve months of earnings, earns 3.85% on the money you put into it, so the bond now pays more than stocks earn by a gap last seen in 2009. On $100,000, the bond pays $4,980 a year, call it $5,000, locked in for ten years. The same $100,000 in an S&P 500 index fund owns $3,850 of company profit, of which $1,060 arrives as cash dividends. The gap, 1.13 points in the bond’s favor, is wider than in any month from October 2009 through August 2026 on the monthly record of the index’s earnings yield and the Fed’s 10-year rate (January 2025 came closest, at 1.08 points). It opened past a point in September, and October’s 1.31 points was the widest monthly reading since September 2009.
A bond that pays more than stocks earn reads as a warning that stock prices are too high for the interest rates they now face; the limit of that reading is that company profits grow and a bond coupon does not, and Wall Street’s forecasts already have the S&P 500 earning more than the bond within a year.
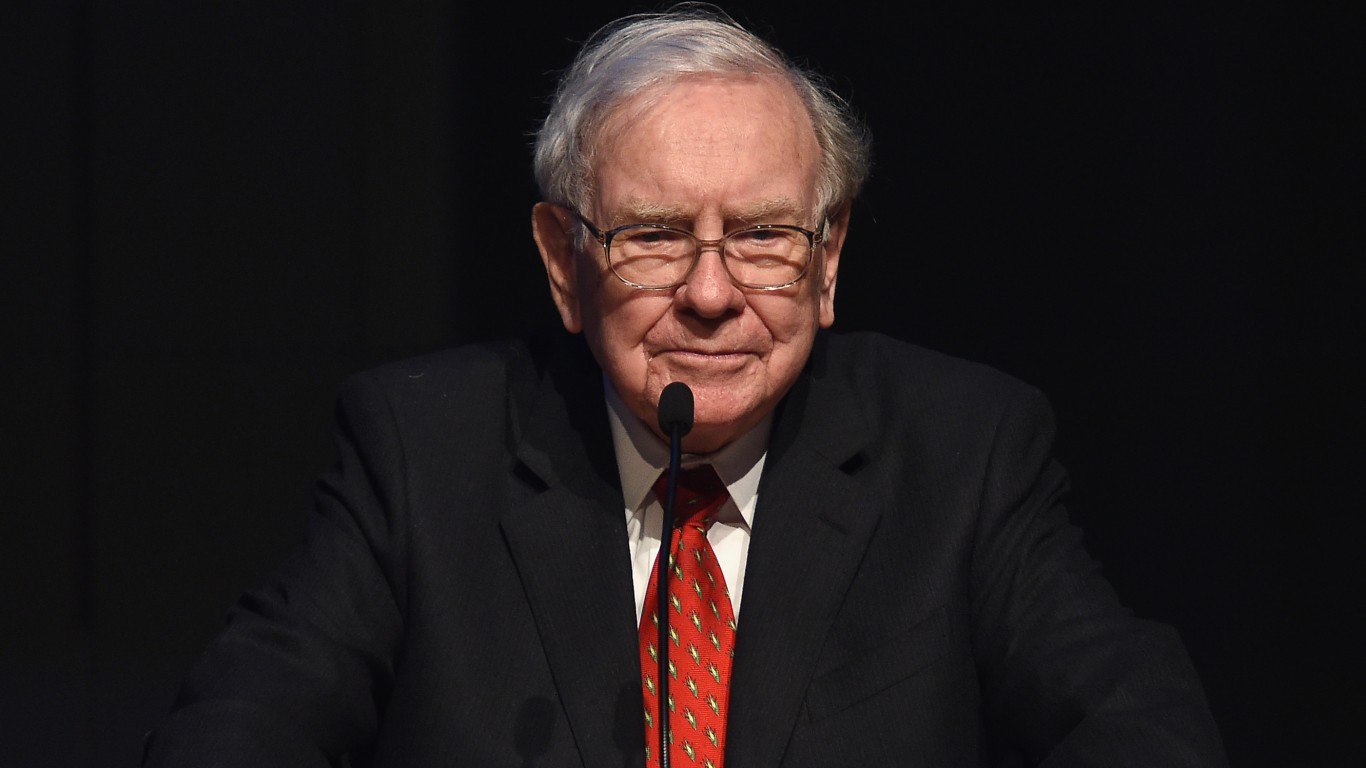
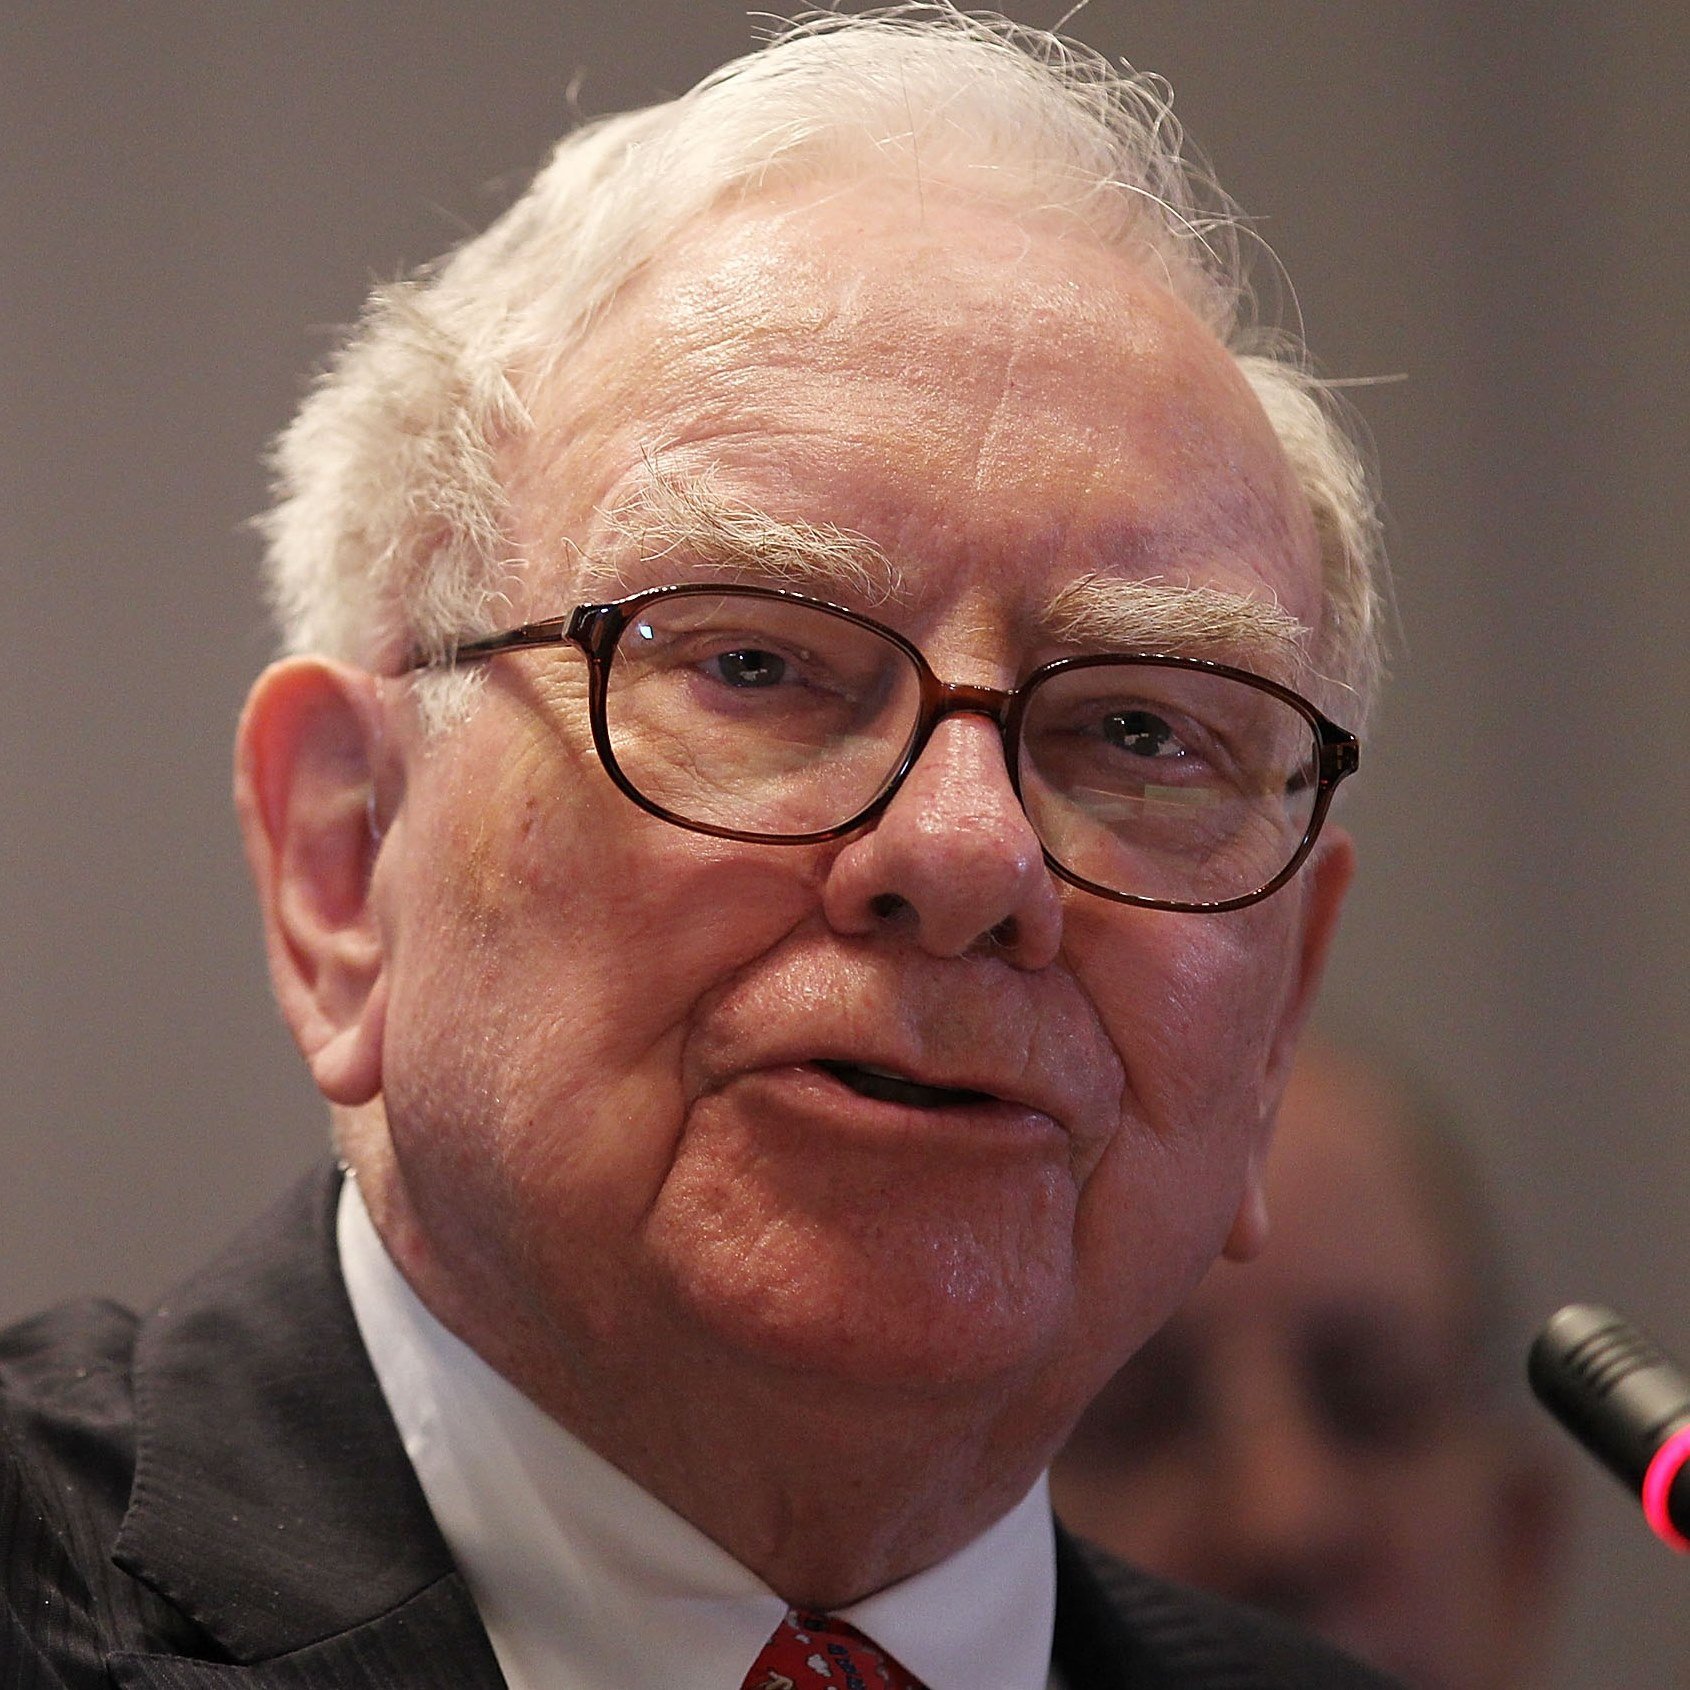
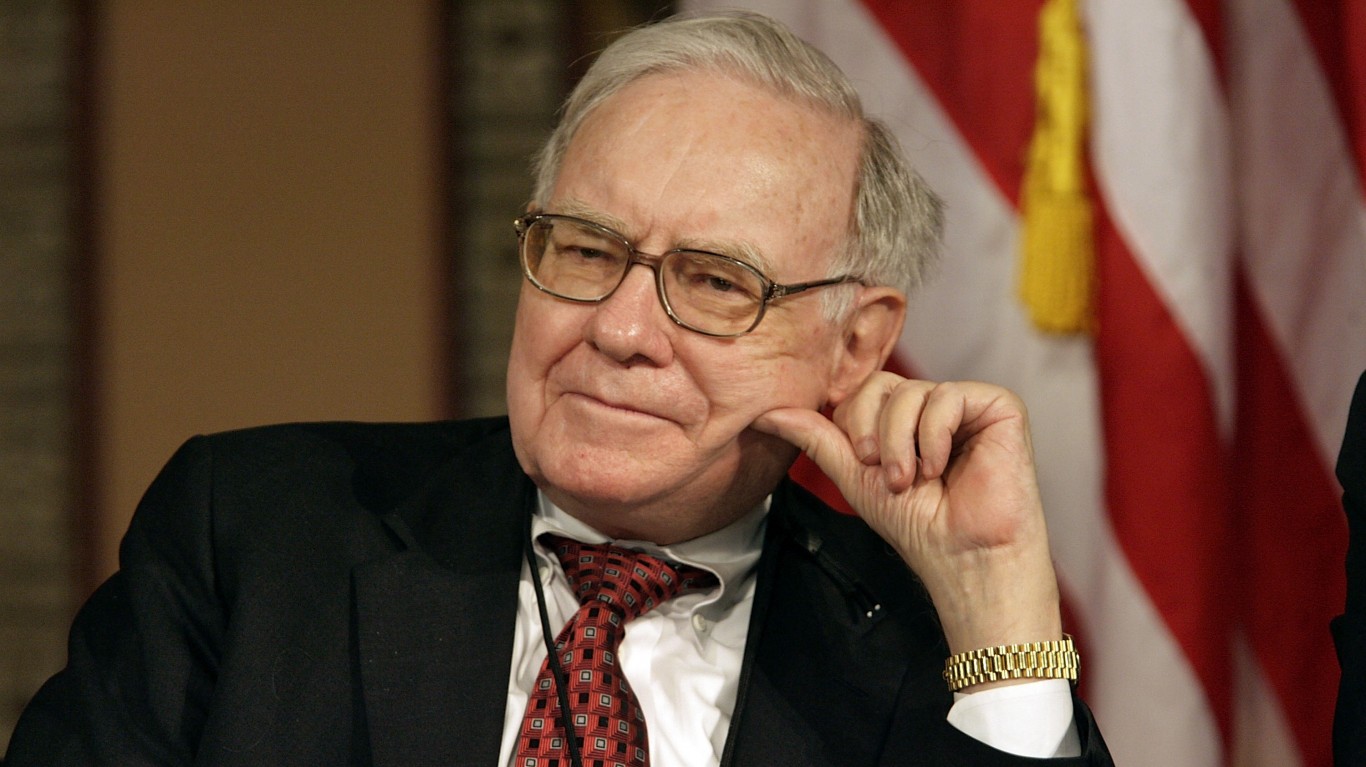
Warren Buffett described the pull in Fortune on Nov. 22, 1999, in a piece written with Carol Loomis. Interest rates, he wrote, "act on financial valuations the way gravity acts on matter: The higher the rate, the greater the downward pull." His example was the 17 years from the end of 1964 to the end of 1981, when long government bond yields went from just over 4% to more than 15%. The Dow Jones Industrial Average closed 1964 at 874.12 and closed 1981 at 875.00. Profits grew the whole time. The gravity of rising rates held the price flat for 17 years, and if you were drawing on a stock portfolio then, you sold shares into a flat market the whole time.
Take Gary and Linda, 67 and 64, a scenario built for this story. He is a retired aerospace engineer, she is a retired school administrator, and they have $1.7 million in a rollover IRA: $1.5 million in an S&P 500 index fund and $200,000 in a money market fund. Social Security pays them $5,300 a month, $63,600 a year, and they spend about $110,000, so the IRA has to supply $46,400 a year, a 2.7% draw. Gary built the spreadsheet. Linda wants to know whether the bond that pays more than their fund earns means they should own it.
The three times the gap was this wide
The record since 1953 shows three stretches when the 10-year yield sat a full point or more above the index’s trailing earnings yield, and what the S&P 500 did afterward.
| When | Earnings yield | 10-year | Gap | S&P 500 a year later | Three years later |
|---|---|---|---|---|---|
| Dec 1999 (peak of the gap Jan 2000) | 3.37% | 6.28% | 2.91 points | -7% | -37% |
| Mar 2002 | 2.14% | 5.28% | 3.14 points | -27% | +4% |
| Feb 2009 | 1.18% | 2.87% | 1.69 points | +35% | +68% |
| Nov 2026 | 3.85% | 4.98% | 1.13 points |
The first stretch ran from March 1996 to August 2002 with one short break, and it took in the dot-com peak; at its widest, in January 2000, the bond paid 6.66% against 3.44% of earnings, 3.22 points. From March 2000 to October 2002 the index fell 41%. The 2009 stretch was the opposite case: the 10-year paid only 2.87% to 3.72%, and the gap opened because earnings had collapsed in the financial crisis, to the point where the index earned 0.81% on its price in June 2009. So history gives you two answers. When high rates opened the gap, as in 2000 and 2002, stocks lost money over the next year both times. When collapsed earnings opened it, stocks were cheap. Today’s gap comes from rates: the 10-year has closed at 5% or higher on 26 days since Sept. 15, something it had not done since July 19, 2007, and it reached 5.31% on Oct. 5. The earnings side is healthy. That is the 2000 shape, at about a third of the 2000 size.
What the bond pays Gary, and what the fund pays him
Gary’s $1.5 million owns $57,750 of S&P 500 profit a year at today’s earnings yield, and $15,900 of it reaches him as dividends. The same $1.5 million in 10-year Treasuries would pay $74,700 a year in interest, $16,950 more than the profit share and $58,800 more than the dividends. The bond’s coupon is 4.7 times the fund’s cash payout, which is the number you feel if you live on the account.
Suppose he moves $500,000 into the 10-year note and keeps $1 million in the fund. The note pays $24,900 a year, every year to 2036, and the remaining fund pays $10,600 in dividends, so their cash income from the IRA rises from $15,900 to $35,500 a year, and the $500,000 produces $249,000 of interest over the ten years without a day of worry about the price. The cost is whatever that $500,000 would have done in the fund, and you only learn it afterward. On the three historical paths, $500,000 left in the index fund was worth $314,689 three years after December 1999, $517,815 three years after March 2002 and $839,816 three years after February 2009, against $74,700 of interest on the note over the same three years. The 2000 path is the one Gary remembers, and it is the shape the market is in now.
Why gravity cuts both ways
Buffett’s point was about price, and the bond’s advantage is about this year’s profit. Those come apart over time, because the coupon is fixed and the profit is not. S&P 500 earnings grew 9.4% a year over the ten years to June 2026, from $121.51 a share to $298.03. At that pace, $3,850 of earnings on $100,000 passes the bond’s $4,980 in 2.9 years and reaches $6,030 in five. At half that pace, 4.7% a year, it takes 5.6 years. Over the longer twenty years to June 2026, earnings grew 4.5% a year, so the slower figure is the safer one for you to plan on.
Wall Street expects the fast one. FactSet’s forward 12-month earnings estimate for the index, $415.82 a share as of Nov. 9, is 40% above the last twelve months of reported earnings. At Tuesday’s close that forecast gives the S&P 500 a forward earnings yield of 5.45%, or $5,452 on $100,000, more than the bond. On forward earnings there is no gap at all. That is the limit of the warning, and it is also where the risk sits: the gap is only closed if the forecasts come true, and in 2000 they did not.
For the fund to beat the note over the full ten years, the index needs to rise 3.9% a year in price on top of its 1.06% dividend, which puts the S&P 500 near 11,158 in 2036.
What Gary should do with the $500,000
The honest reading of the gap is a reason to own the bond for your next ten years of spending, and a poor reason to own it as a bet on the next ten years of prices. Gary and Linda draw $46,400 a year from the IRA. Their $200,000 money market covers 4.3 years of that. Add $500,000 of 10-year Treasuries and the cash and bonds together cover 15.1 years, which means you never have to sell a share of the index fund into a 2000-style decline, or a 2009-style one, until Gary is past 80. Buffett’s own instruction for his wife’s money, in his 2013 shareholder letter, puts 10% in short-term government bonds and 90% in a low-cost S&P 500 index fund; 10% of their $1.7 million is $170,000, and their money market already holds more than that. The $500,000 move takes them to 41% bonds and cash, well past Buffett’s line, and it buys a decade of spending at 4.98% while the earnings side of the fund works to close the gap.
Inside the IRA the choice carries no tax difference, since interest and dividends both come out as ordinary income when withdrawn. In a taxable account, Treasury interest is taxed at ordinary federal rates and the fund’s qualified dividends at 15% for most retired couples, which is a reason to hold the bonds in the IRA and the fund outside it where you can.
The bottom line
A 10-year Treasury at 4.98% pays $4,980 a year on $100,000. The S&P 500 at 26 times earnings earns $3,850, a gap of 1.13 points that was last seen in 2009 and, before that, in the run from 1996 to 2002. Buffett called the force gravity, and from 1964 to 1981 it held the Dow flat for 17 years while profits grew. The counterweight is earnings growth: at the ten-year pace the fund’s profit passes the bond’s coupon in 2.9 years, and on Wall Street’s forecast it already has. For Gary and Linda, $500,000 in the note lifts their cash income from $15,900 to $35,500 a year and covers 15 years of spending with their money market, whichever way the next three years go.
Contact [email protected] for any questions or corrections.
I've been writing about stocks and personal finance for 20+ years. I believe all great companies are tech companies in the long run, and I invest accordingly.