Buffett Said Be Fearful When Others Are Greedy. By One Measure, This Is the Greediest Market in 25 Years.
There are few investors who tend to be quoted as heavily as Warren Buffett. And there's a reason for that. As the long-time chairman of Berkshire Hathaway, Buffett is known not just for his ability to choose great companies, but…

This post may contain links from our sponsors and affiliates, and Flywheel Publishing may receive compensation for actions taken through them.
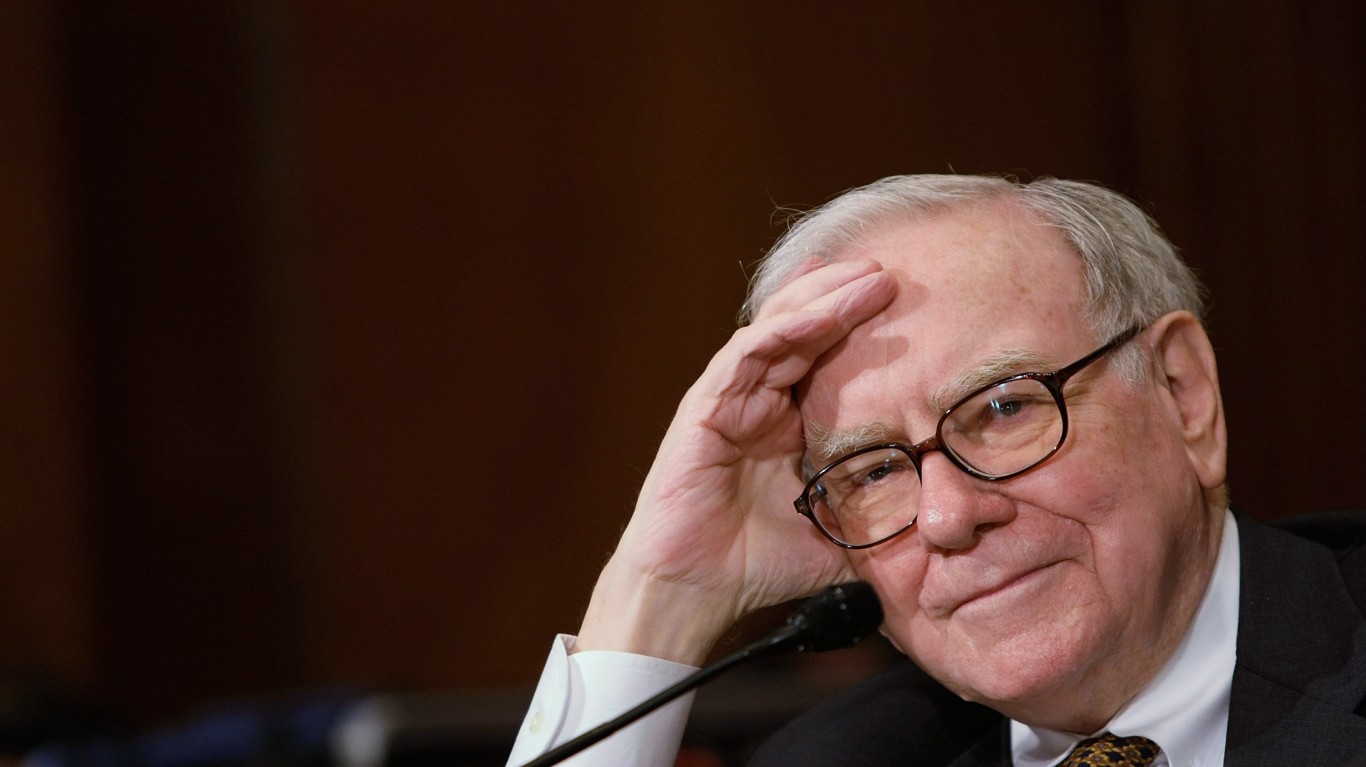
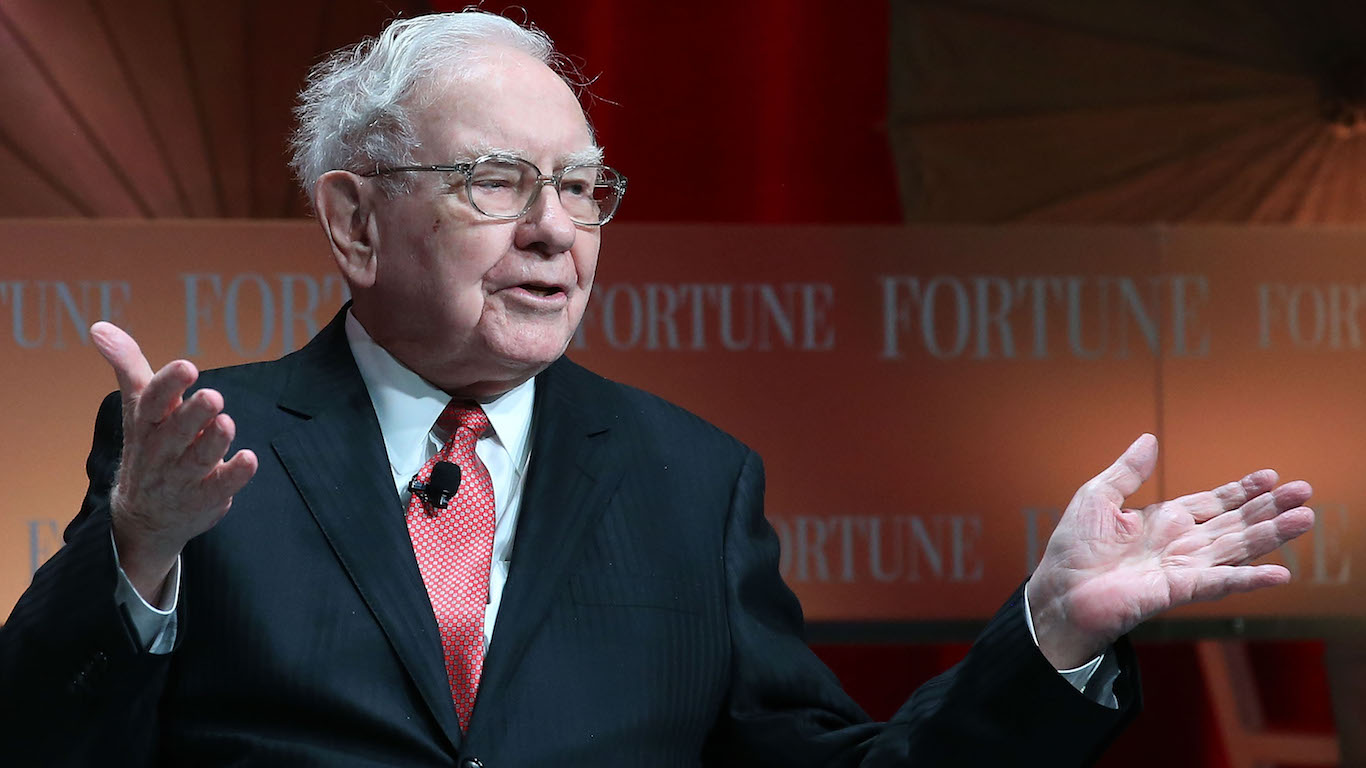
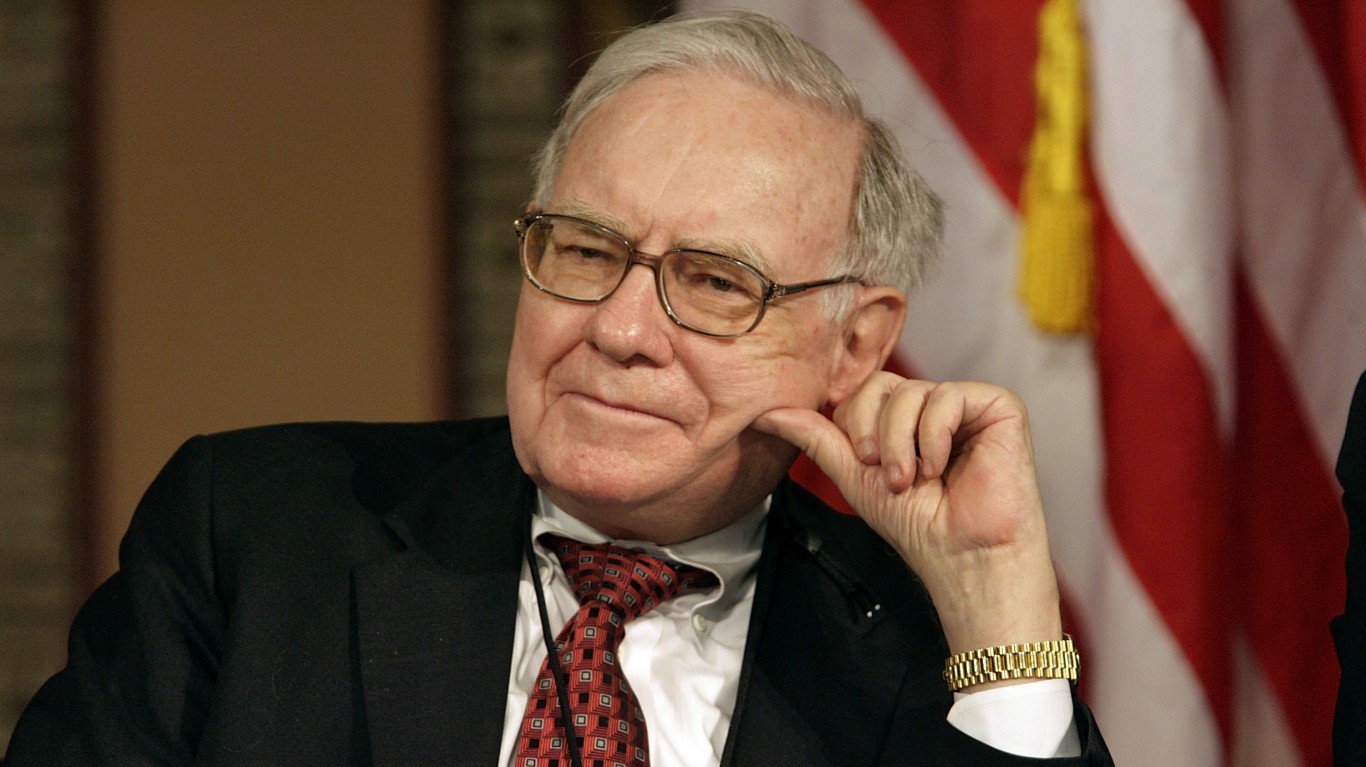
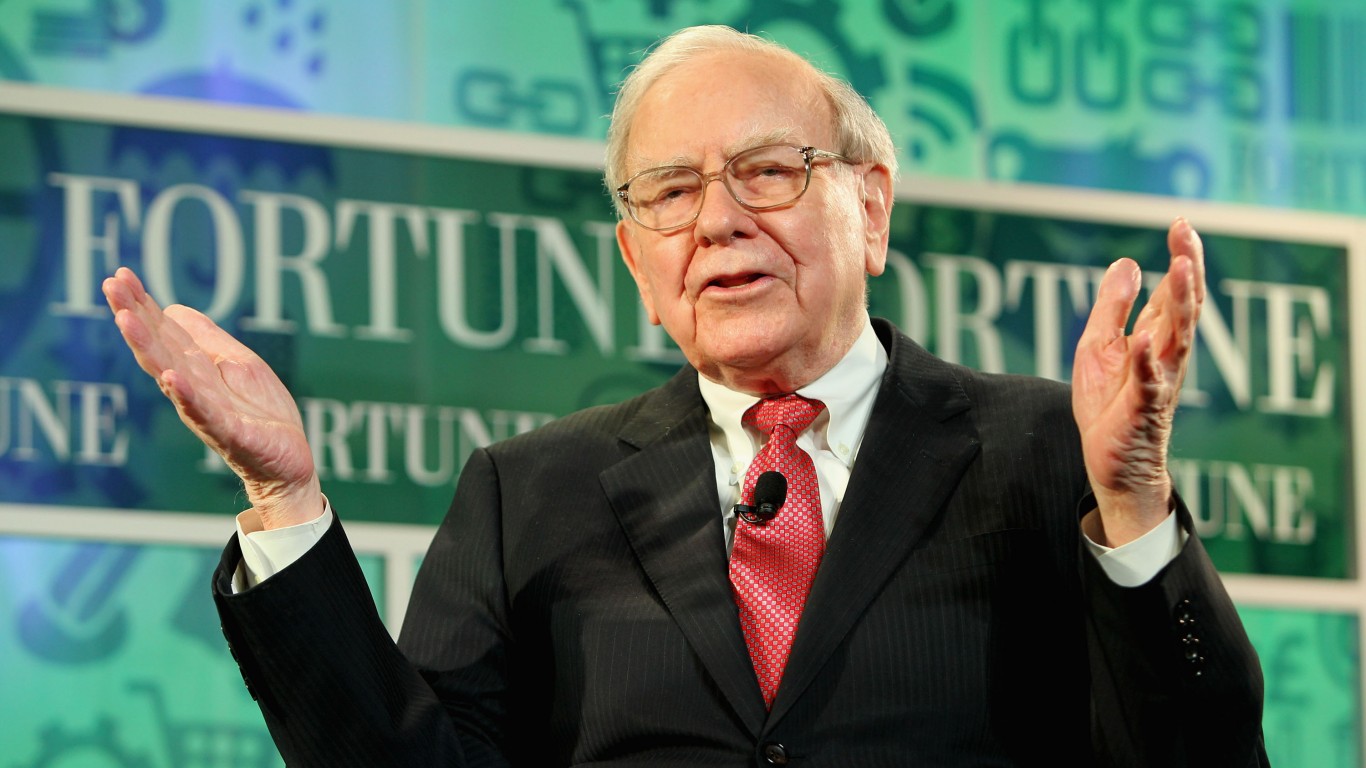
Few investors are quoted as often as Warren Buffett, and for good reason. As the long-time chairman of Berkshire Hathaway (NYSE:BRK.B), Buffett built one of the great investing track records in history, not by chasing trends or reacting to headlines, but by buying quality assets at reasonable prices and holding them for the long haul. Greg Abel succeeded him as CEO at the start of 2026, but the philosophy Buffett spent decades articulating remains the firm’s north star.
At the core of Buffett’s approach is the conviction that markets are driven as much by emotion and hype as by underlying value, and that emotional markets put careless investors at serious risk.
Buffett’s famous quote applies to today’s market
In a 2008 op-ed, Buffett wrote: “A simple rule dictates my buying: Be fearful when others are greedy, and be greedy when others are fearful.” The logic is straightforward. When investors are greedy, markets grow overly optimistic, prices climb well ahead of fundamentals, and risk-taking quietly balloons. Buffett’s prescription for that environment is equally simple: slow down, be selective, and avoid overpaying.
During booming markets, stock prices frequently get pushed above their true value. When that happens, investors take on more risk than they realize, often without noticing until the correction arrives.
The Shiller CAPE ratio suggests a greedy market
One of the most reliable tools for gauging whether the market leans toward greed or fear is the Shiller CAPE ratio. CAPE stands for Cyclically Adjusted Price-to-Earnings, and it measures stock prices against the average inflation-adjusted earnings of the prior ten years. Smoothing earnings over a full decade strips out the distortions of individual boom-or-bust years, giving a cleaner read on whether the market is genuinely expensive or just temporarily jittery.
Historically, the CAPE ratio for the S&P 500 has averaged around 17. As of mid-2026, it sits near 42, a level that signals extremely elevated valuations. To put that in context, the only other time in more than 140 years of U.S. market history that the CAPE climbed above 40 was in late 1999 and early 2000, during the dot-com peak, when it reached roughly 44. After the bubble burst, the Nasdaq Composite fell 77% from its March 2000 peak to its October 2002 trough, while the S&P 500 shed about 49% of its value. The current reading also sits well above the pre-1929 crash level of roughly 32 and far above the pre-financial-crisis peak near 27 in 2007.
Some analysts argue that today’s index composition, heavier in durable-earnings software and large-cap technology than the cyclical industrials that dominated earlier eras, justifies a structurally higher CAPE. Others counter that elevated readings have historically been a poor reason to assume the rules have changed. Both views deserve attention, but neither changes the basic arithmetic: investors today are paying unusually high prices for each dollar of earnings.
The current AI-driven rally adds another dimension. Enthusiasm over artificial intelligence has driven valuations in the largest technology companies to levels reminiscent of the excitement around internet infrastructure in the late 1990s, making the dot-com comparison more than just a convenient historical footnote.
What investors should consider in a greedy market
If today’s market reflects elevated optimism, the takeaway is not to panic. What it does call for is a careful review of your portfolio to ensure your asset mix is age-appropriate and well-diversified. Before adding stocks, it pays to confirm that what you are buying is actually worth what you are paying for it.
Thinking long-term, as Buffett has always advocated, remains the most durable defense. Even if the market experiences a near-term decline, staying invested through the cycle has historically been the path to avoiding permanent losses and building wealth over time.
Holding some cash is also worth considering, precisely so you are positioned to put money to work when fear eventually replaces greed. As of the first quarter of 2026, Berkshire Hathaway held $373.5 billion in cash, cash equivalents, and short-term Treasury bills, a figure that has drawn wide attention as a signal of patience rather than panic.
Market downturns are a recurring feature of investing, not an aberration. They may not arrive with the severity of the dot-com collapse, but periods of elevated valuation have consistently preceded periods of weaker returns. Being prepared for that reality is not pessimism. It is the discipline Buffett has been describing for decades.
Editor’s note: This article has been updated to reflect that Greg Abel succeeded Warren Buffett as Berkshire Hathaway CEO at the start of 2026, to refresh the Shiller CAPE ratio to approximately 42 as of mid-2026, to correct the Nasdaq dot-com decline figure to 77% based on Goldman Sachs historical data, and to add context on the current AI-driven rally and Berkshire’s $373.5 billion cash position as of Q1 2026.
Contact [email protected] for any questions or corrections.
Maurie Backman has more than a decade of experience writing about financial topics, including retirement, investing, Social Security, and real estate. Her work has appeared on sites that include The Motley Fool, USA Today, U.S. News & World Report, and Kiplinger.
Prior to becoming a full-time financial writer, Maurie worked in the financial industry trading distressed debt. She then changed course and spent a few years designing electronic toys. After a stint in content marketing and UX, she shifted back into writing and has since covered everything from the housing market to estate planning to Medicare.
When she's not busy writing, Maurie can be found hiking, walking her dogs, driving her kids to their various sports practices and games, and curling up with a good book. She cooks on occasion and bakes way too often.