Your goal as an investor is to make money, hopefully by buying quality stocks and holding them for many years. And while you don’t necessarily want to try timing the market, it’s important to know when stocks are overvalued on a whole.
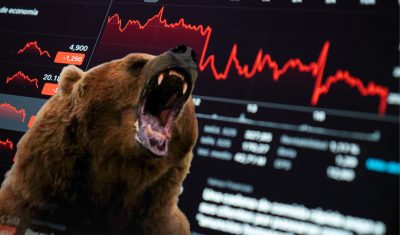
Overvalued stocks are a problem because they represent a disconnect from fundamentals like earnings and growth potential. When the market on a whole is overvalued, a correction — and sometimes a steep decline — can follow. That could lead to big portfolio losses.
The Shiller CAPE ratio has long been a popular measure of whether stocks are expensive or not. It measures stock prices relative to average inflation-adjusted earnings over the past 10 years.
But there’s another metric investing giant Warren Buffett has long relied on to evaluate the stock market. And it’s now flashing one of its strongest warning signals ever.
What the Buffett Indicator is — and why it matters
The Buffett Indicator is calculated by taking total U.S. stock market capitalization, or market cap, and dividing it by U.S. GDP. It basically answers the question: How large is the stock market relative to the economy that supports it?
In a 2001 interview, Buffett called that indicator “probably the best single measure of where valuations stand at any given moment.” And its average historical range is roughly 75% to 90%. Levels above that range suggest the market may be getting ahead of underlying economic growth.
Knowing that, it may or may not surprise you to learn that the Buffett Indicator is dramatically higher today. As of this writing, it’s at 226%.
For context, during the dot.com peak in 2000, the Buffett Indicator reached about 140%. And most of us know what happened next.
Once that bubble burst, stock values plummeted, and that crash lasted a good two and half years. Reading between the lines, a value of 226% signals that stocks may be extremely overvalued — and that a decline may be coming.
Over long periods, stock market growth tends to reasonably align with economic growth. When market cap grows much faster than GDP, it often reflects strong investor optimism more so than actual value.
What investors should do now
Even though the Buffett Indicator is sky-high, that doesn’t mean a stock market crash is right around the corner. So there’s no need to panic. But what you should do as an investor is exercise some caution and reset some expectations.
The stock market has delivered outsized gains in recent years. You may not see the same level of gains in the coming years, and that’s something to prepare for. If you’re nearing retirement, you may want to lock in some gains now in case the market takes a tumble.
It’s also a good time to rebalance your portfolio and make sure you’re comfortable with your asset allocation. You may also want to stockpile some cash in case the market crashes, as that could give you an opportunity to buy the (relative) dip.
Finally, be choosy with the stocks you buy, and focus on value more so than noise. In expensive markets, companies with strong earnings and competitive advantages tend to hold up fairly well, so it’s businesses like those you should aim to add to your portfolio.
Contact [email protected] for any questions or corrections.