I’ll cut straight to the call. Super Micro Computer (NASDAQ:SMCI | SMCI Price Prediction) has been one of the most punished AI infrastructure names of the past year, but our proprietary model sees the recent washout as overdone.
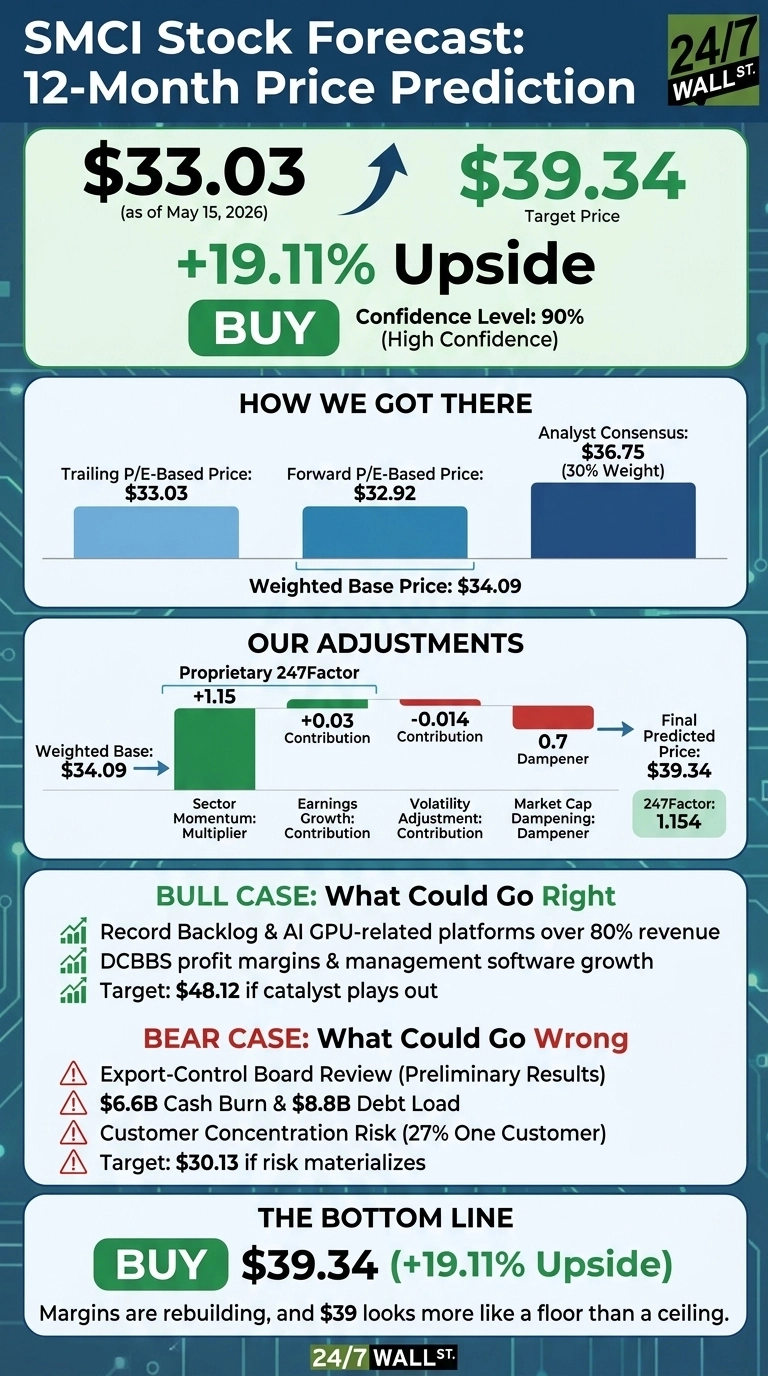
Our 24/7 Wall St. price target for SMCI is $39.34, implying 19.11% upside from $33.03. The recommendation is buy, with a confidence level we rate at 90%. The thesis: margins are rebuilding faster than the stock price suggests, and $39 looks more like a base than a ceiling.
24/7 Wall St. Price Target Summary
| Metric | Value |
|---|---|
| Current Price | $33.03 |
| 24/7 Wall St. Price Target | $39.34 |
| Upside | 19.11% |
| Recommendation | BUY |
| Confidence Level | 90% |
A Brutal Year, A Sharp Snapback
SMCI is down 26.6% over the past year, but up 21.43% in the last month and 12.85% year to date. The stock sits 41% below its 52-week high of $62.36 and well off the $19.48 floor printed earlier this cycle.
Q3 FY2026 reset the narrative. Revenue of $10.24 billion missed the $12.45 billion consensus, yet non-GAAP EPS of $0.84 beat by 34.51%. Net income surged 344.38% YoY to $483 million, and gross margin recovered to 9.9% GAAP from 6.3% the prior quarter. Shares ripped from $27.96 at filing to $33.62 a day later.
The Case for $48+

Bulls have a credible path to $48.12, our optimistic 12-month scenario. CEO Charles Liang told investors “our backlog is now at another record high”, with AI GPU-related platforms contributing over 80% of revenue. Management is targeting $12 billion in Q4 and $40 billion for the full year.
The bigger story is mix. Liang noted DCBBS profit margins are “often above 20%”, and he expects DCBBS to drive at least 20% of net income within two years. Management software bookings climbed to more than $46 million this quarter. If SMCI sustains double-digit gross margins and ships first on Vera Rubin NVL72 systems, a re-rating toward analyst high targets becomes plausible.

What Could Go Wrong
The risks are real. Q3 burned $6.6 billion in operating cash, total debt sits at $8.8 billion, and cash is down 49.12% YoY to $1.29 billion. Results are preliminary and unaudited pending a Board export-control review. One large customer represents 27% of revenue. The bear scenario maps to $30.13, an 8.77% drawdown.

Counterfactually, the cash burn reflects a $10 billion reduction in accounts payable and inventory build rather than operating losses. CFO David Weigand said “we do not believe we will need to restate” earnings.
SMCI Price Prediction 2026-2030
My price target of $39.34 stands, with a buy rating and 90% confidence. The tipping factor is the margin rebound to 10.1% non-GAAP, which validates the higher-value mix shift. I’d be a buyer here if Q4 lands inside the $11.0B to $12.5B guide with stable margins. I’d stay on the sidelines if the 10-Q filing slips or the Board review surfaces restatement risk.
| Year | 24/7 Wall St. Price Target |
|---|---|
| 2026 | $35.50 |
| 2027 | $40.66 |
| 2028 | $44.24 |
| 2029 | $49.76 |
| 2030 | $52.39 |
These projections assume SMCI executes on its DCBBS roadmap and sustains double-digit gross margins. Significant upside or downside could come from Vera Rubin allocations, sovereign AI wins, or any restatement tied to the export-control review.
Contact [email protected] for any questions or corrections.