The VanEck Retail ETF (NASDAQ:RTH) and the SPDR S&P Retail ETF (NYSEARCA:XRT) both sit in the retail bucket, yet the year-to-date gap between them tells a different story. RTH is up 5.79% in 2026 while XRT is down 6.25%. Same sector label, two very different bets, and the difference comes down to one decision: who gets to vote, and how loudly.
What Each Fund Is Actually Betting On
RTH holds roughly 25 retail names and weights them by market capitalization. That means Amazon (NASDAQ:AMZN | AMZN Price Prediction), with a market cap of $2.9 trillion, plus Walmart (NYSE:WMT) at roughly $1.06 trillion, dominate the portfolio. RTH is really a concentrated bet on mega-cap consumer platforms. Owning RTH means importing Amazon’s AWS thesis into a retail allocation, because AWS posted 28% growth in Q1 2026, its fastest pace in 15 quarters, and that engine moves the fund.
XRT takes the opposite approach. It holds roughly 75 names and rebalances them quarterly back to equal weight. A struggling auto parts chain, a regional apparel retailer, and Amazon all carry roughly the same vote. That makes XRT a purer read on brick-and-mortar retail health rather than a stealth tech position.
Where the Difference Shows Up
[stock_price_widget ticker=”RTH”]
[stock_scenario_widget ticker=”RTH”]
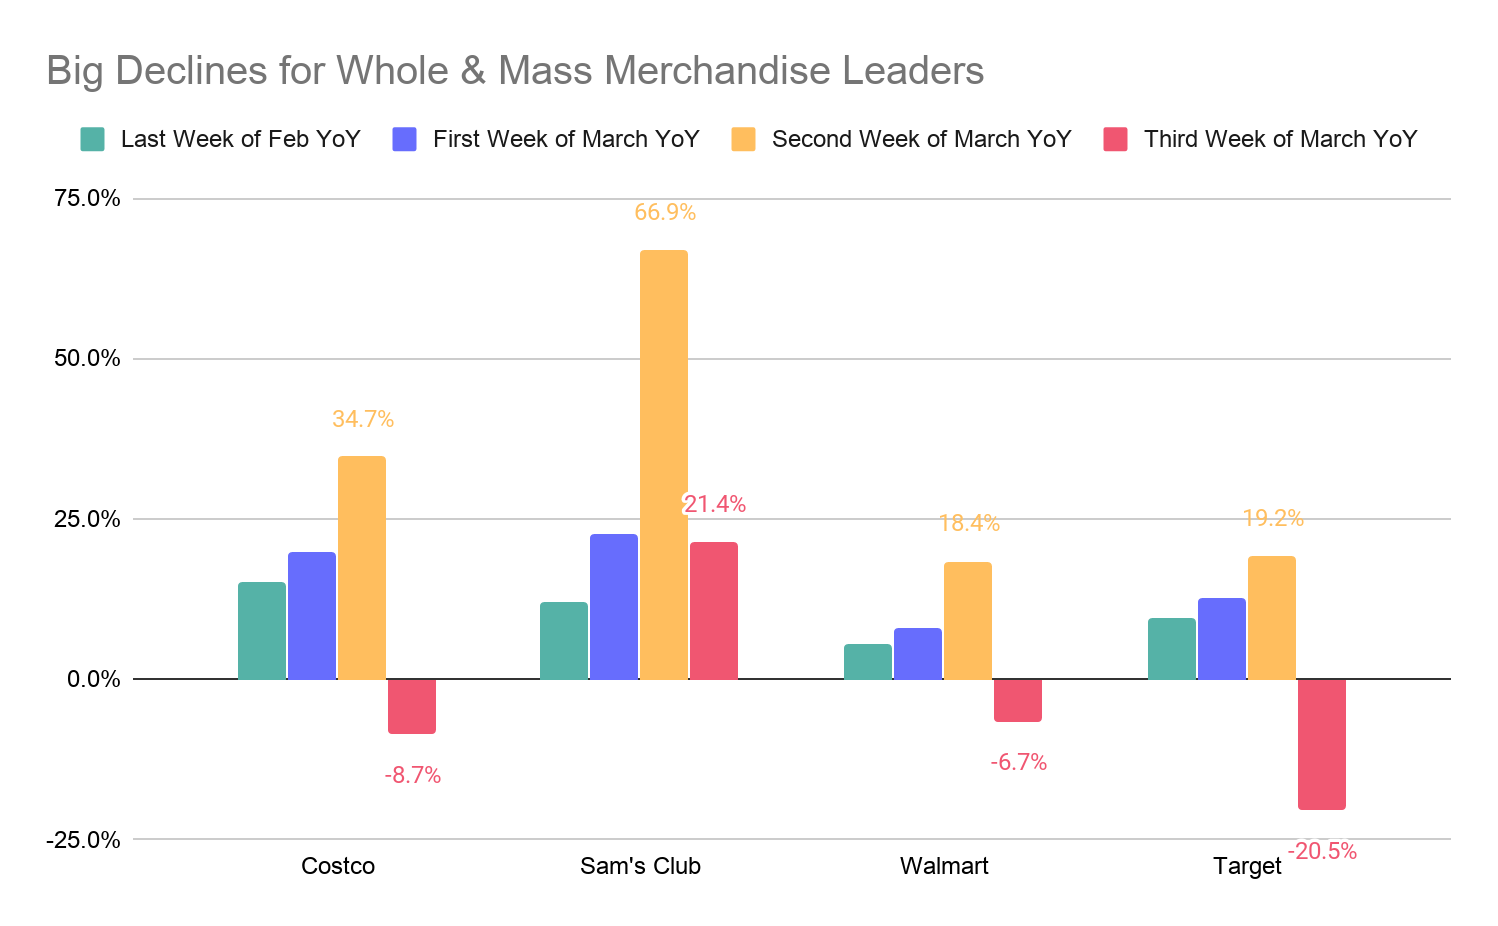
Amazon climbed 19.26% from January 2 through May 13, and that single name drives a large share of RTH’s return. In XRT, Amazon contributes the same as any other holding. Even strong YTD moves from Target (NYSE:TGT) at 26.69% and Walmart at 18.48% have not been enough to offset weakness across XRT’s long tail of specialty and discretionary retailers.
[stock_price_widget ticker=”XRT”]
[stock_scenario_widget ticker=”XRT”]
The five-year picture is starker. RTH is up 60.78% while XRT is down 7.76%. That gap reflects two different asset classes wearing the same uniform.
Practical Comparison
| Metric | RTH | XRT |
|---|---|---|
| Weighting | Market-cap | Equal-weight (quarterly reset) |
| Holdings | ~25 | ~75+ |
| YTD 2026 | +5.79% | -6.25% |
| 1-year | +13.88% | +7.94% |
| 5-year | +60.78% | -7.76% |
| Implicit bet | Mega-cap platforms, AWS, ads | Brick-and-mortar breadth |
The Verdict
RTH fits an investor who wants concentrated exposure to the winners of digital retail and is comfortable owning what is effectively a partial Amazon and Walmart position. XRT fits an investor who believes specialty retail, auto parts, and discretionary store chains are mispriced and ready to mean-revert. For most investors today, RTH is the cleaner expression of where retail profit pools actually sit. What flips the call is a small-cap rotation or a meaningful Amazon drawdown, since both would shift the math in XRT’s favor overnight.
Contact [email protected] for any questions or corrections.