Boring Beats Brilliant: How a Utilities ETF Has Quietly Trounced the S&P 500 in Every Recession This Century
Utility stocks have commanded unusual attention from investors lately, and the driving force is the AI build-out reshaping electricity demand across the country. Data centers require enormous, continuous power, and as hyperscalers accelerate infrastructure expansion, capital has flowed steadily toward…

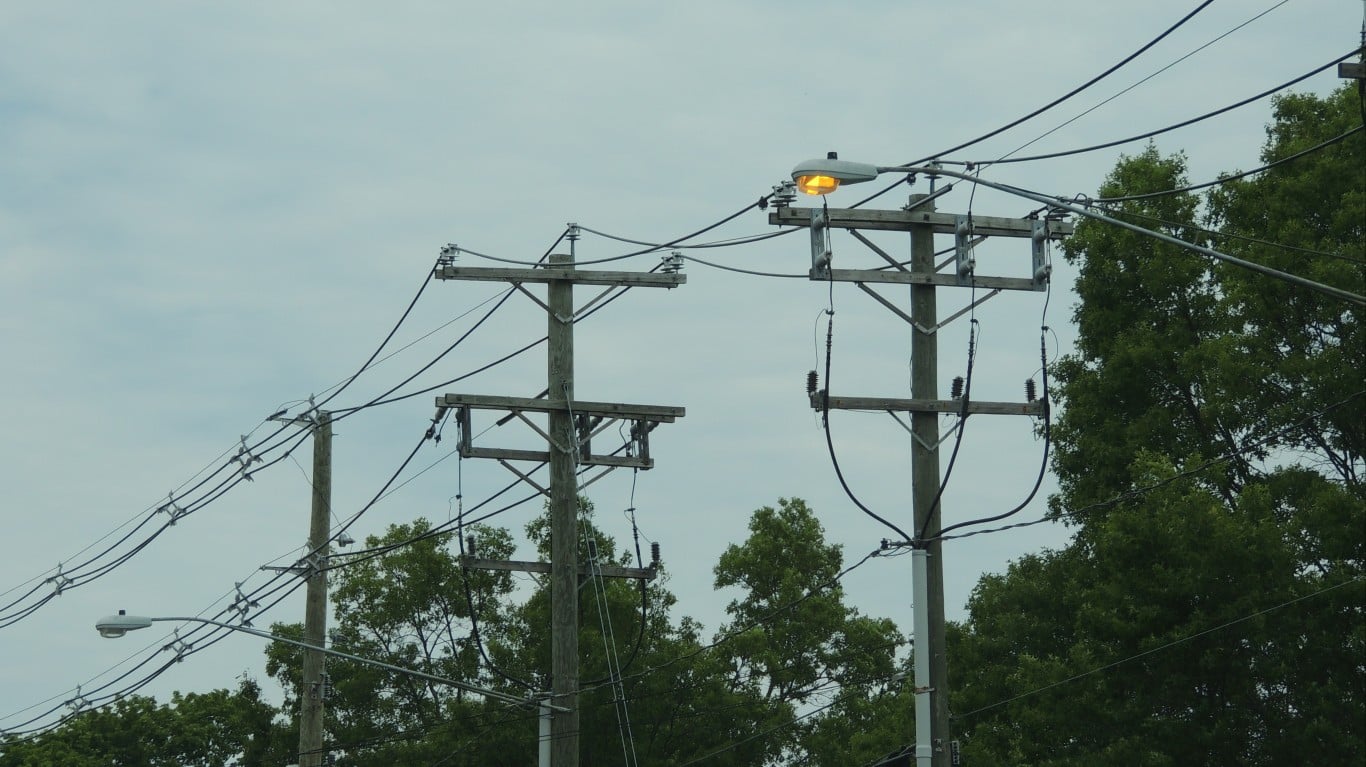
Utility stocks have commanded unusual attention from investors lately, and the driving force is the AI build-out reshaping electricity demand across the country. Data centers require enormous, continuous power, and as hyperscalers accelerate infrastructure expansion, capital has flowed steadily toward utility companies positioned to benefit from rising load growth, grid transmission upgrades, and decades of infrastructure spending ahead. Goldman Sachs Research projects U.S. data center power demand will climb from 31 gigawatts in 2025 to 41 GW in 2026 and 66 GW by 2027. That kind of step-change in load growth is not something the U.S. power grid has absorbed in any living investor’s memory.
For investors who have long held utilities as a classic defensive position, the sector’s sudden spotlight carries a bittersweet quality. The old description was “widows and orphans” stocks: investments stable enough to preserve capital and deliver dependable income for retirees and others who could not afford large drawdowns. That reputation rested on two structural pillars. First, electricity and gas demand holds up through recessions because households and businesses do not meaningfully cut power consumption the way they cut discretionary spending. Second, regulated pricing structures provided predictable cash flows and reliable dividends quarter after quarter.
The sector looks meaningfully different today. Deloitte projects data center demand alone could reach 176 gigawatts by 2035, a fivefold jump from 2024 levels. Electric and gas utilities are forecasting record capital expenditures, expected to reach $212 billion in 2025 across 47 major utilities, a 22% jump year over year. Add rising natural disaster risks, decarbonization mandates, and a grid interconnection queue carrying two terawatts of backlogged capacity, and the utilities sector is a different animal than it was twenty years ago.
With that backdrop in mind, I took a historical look at how utilities have actually performed against the broader market during periods of economic stress. Using testfolio.io, I compared the State Street Utilities Select Sector SPDR ETF (NYSEARCA:XLU) against the State Street S&P 500 ETF Trust (NYSEARCA:SPY) across major recessions and bear markets this century.
What Is XLU?
Before getting into the comparison, a brief description helps for those less familiar with the fund. XLU seeks to provide investment results that correspond to the price and yield performance of the Utilities Select Sector Index, which is designed to provide effective representation of the utilities sector of the S&P 500. The ETF currently holds 34 individual stocks. Because those companies come directly from the S&P 500, they have already passed screens for market size, liquidity, and earnings consistency before entering the fund.
The ETF weights its holdings by market capitalization, which creates a meaningful tilt toward the largest names. The top positions are NextEra Energy at roughly 12.8%, Southern Company at about 7.6%, Duke Energy near 6.9%, Constellation Energy at 5.5%, and American Electric Power at approximately 5.2%. At the sector level, electric utilities account for 65.7% of the portfolio as of the most recent SEC filing. Multi-utilities claim roughly another quarter, with the remainder spread across renewable electricity producers, independent power operators, water utilities, and gas utilities.
XLU carries a 30-day yield of approximately 2.68% as of early July 2026, with 34 holdings and an AUM of roughly $23.6 billion. One metric particularly worth watching with defensive sectors is beta, which measures sensitivity to the broader market’s moves. According to Yahoo Finance, XLU carries a five-year beta of just 0.58, meaning it has historically moved well below the broader market’s amplitude in either direction.
How XLU Held Up Against the S&P 500 During Recessions
I backtested XLU against SPY over a 27.41-year period running from December 22, 1998 through May 19, 2026. The first takeaway is straightforward: utilities did not outperform the broader market over the full stretch. XLU compounded at 7.74% annualized, while SPY returned 8.68%. That gap is exactly what you would expect when overweighting a lower-beta defensive sector at the expense of higher-growth areas like technology, communications, and consumer discretionary.
The more interesting story surfaces during downturns. During the 2008 financial crisis, SPY ended the year down 36.81%, while XLU declined a smaller 28.92%. That is still a painful loss, and it is worth remembering XLU is a 100% equity fund with no downside hedging or bond overlay. Even so, the outperformance during one of the worst market dislocations in a century was meaningful.
Then came 2022. While SPY fell 18.17% during the inflation-driven bear market, XLU finished the year positive, up 1.42% on a total return basis. That result deserves emphasis: traditional diversifiers like investment-grade bonds also lost ground that year as rising interest rates hammered fixed income valuations. Utilities provided shelter when much of the usual toolkit failed.
Taken together, the historical record shows utilities consistently absorbing a smaller share of market drawdowns. The caveat matters, though. Demand could reach 176 GW for data centers by 2035, the energy mix is shifting rapidly toward renewables, and two terawatts of capacity currently sit backlogged in interconnection queues. The capital commitments required to modernize the grid represent obligations that did not exist in prior cycles. Electric and gas utility capex is expected to surpass $1 trillion cumulatively over the five years from 2025 to 2029, across the 47 biggest investor-owned utilities. That spending level introduces financing risk, execution risk, and political risk that were not material factors in 2001 or even 2008.
So while XLU’s defensive track record across recessions this century is genuine, investors today are buying a sector in the middle of a structural transformation. The historical pattern of outperforming during drawdowns reflects the old utility model, one built on stable, predictable cash flows from regulated rate structures. Whether those characteristics fully persist as the sector takes on AI-era capital commitments is a question worth asking before assuming the past is a reliable guide.
Editor’s note: This update corrects the fund’s holding count from 31 to 34 stocks, reflects the current 30-day SEC yield of approximately 2.68% and AUM of roughly $23.6 billion as of early July 2026, adds Goldman Sachs projections for U.S. data center power demand reaching 66 GW by 2027, and includes Deloitte and Edison Electric Institute data on utility capital expenditure forecasts through 2029.
Contact [email protected] for any questions or corrections.
Tony Dong is the founder of ETF Portfolio Blueprint. He also serves as Lead ETF Analyst for ETF Central, a partnership between Trackinsight and the NYSE.
Tony’s work focuses on ETF strategy, portfolio construction, and risk management, with an emphasis on making complex investment concepts accessible to everyday investors. His insights and analysis have also appeared in U.S. News & World Report, Kiplinger, MoneySense, and The Motley Fool.
Tony holds a Master of Science degree in enterprise risk management from Columbia University and the Certified ETF Advisor (CETF) designation from The ETF Institute.