Prediction: Apple Stock Will Trade at This Price in Two Years
Apple (NASDAQ:AAPL | AAPL Price Prediction) just reported its best March quarter ever, with revenue of $111.18 billion and double-digit growth across every geographic segment. iPhone revenue alone hit $56.99 billion on what Tim Cook called “extraordinary demand for the…


Apple (NASDAQ:AAPL | AAPL Price Prediction) just reported its best March quarter ever, with revenue of $111.18 billion and double-digit growth across every geographic segment. iPhone revenue alone hit $56.99 billion on what Tim Cook called “extraordinary demand for the iPhone 17 lineup.”
Services hit $30.976 billion, another all-time record. The stock is up 13.81% year-to-date and sits at $308.82. Can Apple reach $450 by 2028?

What’s Holding Apple Back Right Now
Apple is digesting a massive run. Shares are up 53.98% over the past year and 13.15% in just the past month, but the stock now trades less than 1% from its 52-week high of $311.40. That perch invites consolidation. The 1-week return of 2.86% suggests buyers are still showing up, but with a beta of 1.065, Apple carries meaningful volatility when sentiment flips.
Valuation is another overhang. Apple trades at a trailing P/E of 37 and a price-to-sales of 10. Skeptics argue the easy multiple expansion is done. Layer in tariff exposure, Greater China dependency, and regulatory pressure, and the bear case writes itself.
Wall Street Sees Flat. Our Model Says 17% Upside
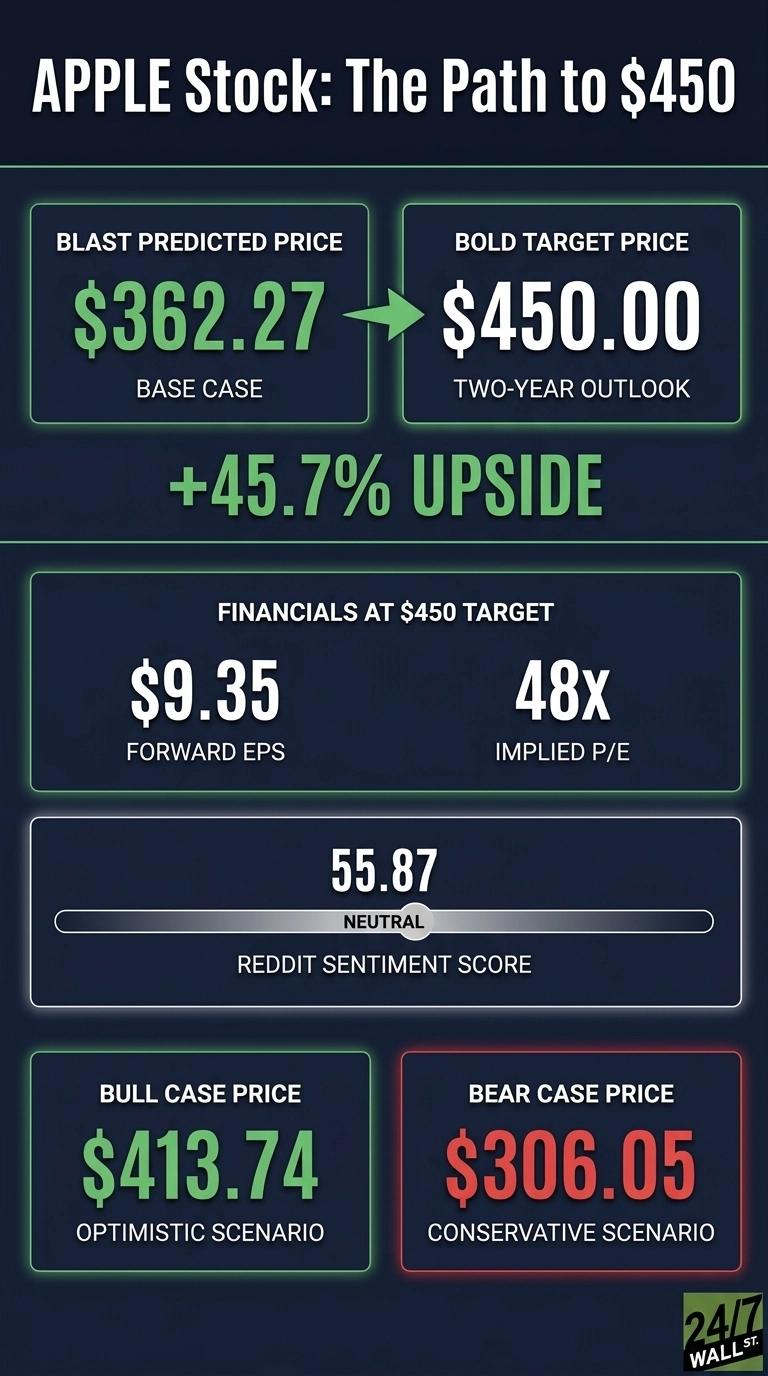
The average analyst target sits at $308.65, basically equal to the current price. The breakdown: 7 Strong Buy, 25 Buy, 14 Hold, 1 Sell, 1 Strong Sell. Our internal model is more constructive, with a base case of $362.27 (a 17.31% expected return at 0.9 confidence), an optimistic case of $413.74, and a bear case of $306.05.
The Street is too anchored. Apple just delivered 21.8% earnings growth with 67% bullish analyst sentiment, yet targets still cluster at the current price. Analysts have not caught up to the iPhone 17 cycle.

The Path to $450 Per Share
Reaching $450 from today’s price of $308.82 would require a gain of 45.7%. That exceeds our base case and optimistic scenario.
With forward EPS of $9.35, a price of $450 implies a forward P/E of 48x. Our base case of $362.27 already implies 37x, meaning the bold target requires roughly 11x of additional multiple expansion on top of base case earnings growth.
That is a stretch. But here is the case. Apple has beaten EPS estimates 8 consecutive quarters. Q1 FY2026 EPS hit $2.84 and Q2 FY2026 came in at $2.01. Cook noted the installed base now has more than 2.5 billion active devices, which drives Services to all-time records. The board just authorized a $100 billion buyback and raised the dividend 4%.
If forward EPS compounds into the $11-12 range over two years, $450 only requires a P/E in the high 30s rather than 48. That is the forward P/E compression story. The biggest risk is a tariff or China shock that compresses iPhone demand.
Where Apple Trades Today vs Its Earnings Power
At $308.82 and forward EPS of $9.35, Apple trades at a forward P/E of 33x. That is reasonable for a business growing revenue 16.6% with a 27% net margin. Shares sit near the 52-week high of $311.40, with the low at $194.30. The 10-year total return of 1,285.73% shows what compounding earnings power delivers over time.
BofA raised the firm’s price target on Apple to $380 from $330 and keeps a Buy rating on the shares.
Is $450 Realistic?
$450 by 2028 requires a 45.7% gain, well above our base case of 17.31% upside. It is a stretch but achievable.
Three things need to go right: forward EPS climbs toward $11-12 on iPhone 17 cycle strength and Services growth, the buyback shrinks the share count, and the China tariff overhang eases. What derails it: a demand shock from trade friction or stalled AI rollout. We’ve outlined the blueprint for how Apple could reach $450 in 2028.
Contact [email protected] for any questions or corrections.
Vandita Jadeja is a financial publisher with over a decade of experience writing about financial topics, including investment, savings, retirement, insurance and banking. Vandita is a Chartered Accountant who loves to debunk financial concepts for readers.
Her work has appeared on sites that include The Motley Fool, InvestorPlace, and Benzinga. She covers investing and focuses on stock picks and price prediction for 24/7 Wall St.
When not looking for the next stock investment opportunity, she can be found traveling, reading, chasing sunsets and enjoying her iced latte.