The Lowest-Beta Mega-Cap Just Got a $358 Target
Apple just posted its strongest June quarter ever, yet the stock sits 6% below its 52-week high while a supply-chain dispute and fading tariff tailwinds threaten to complicate the bullish case that Wall St. keeps building.


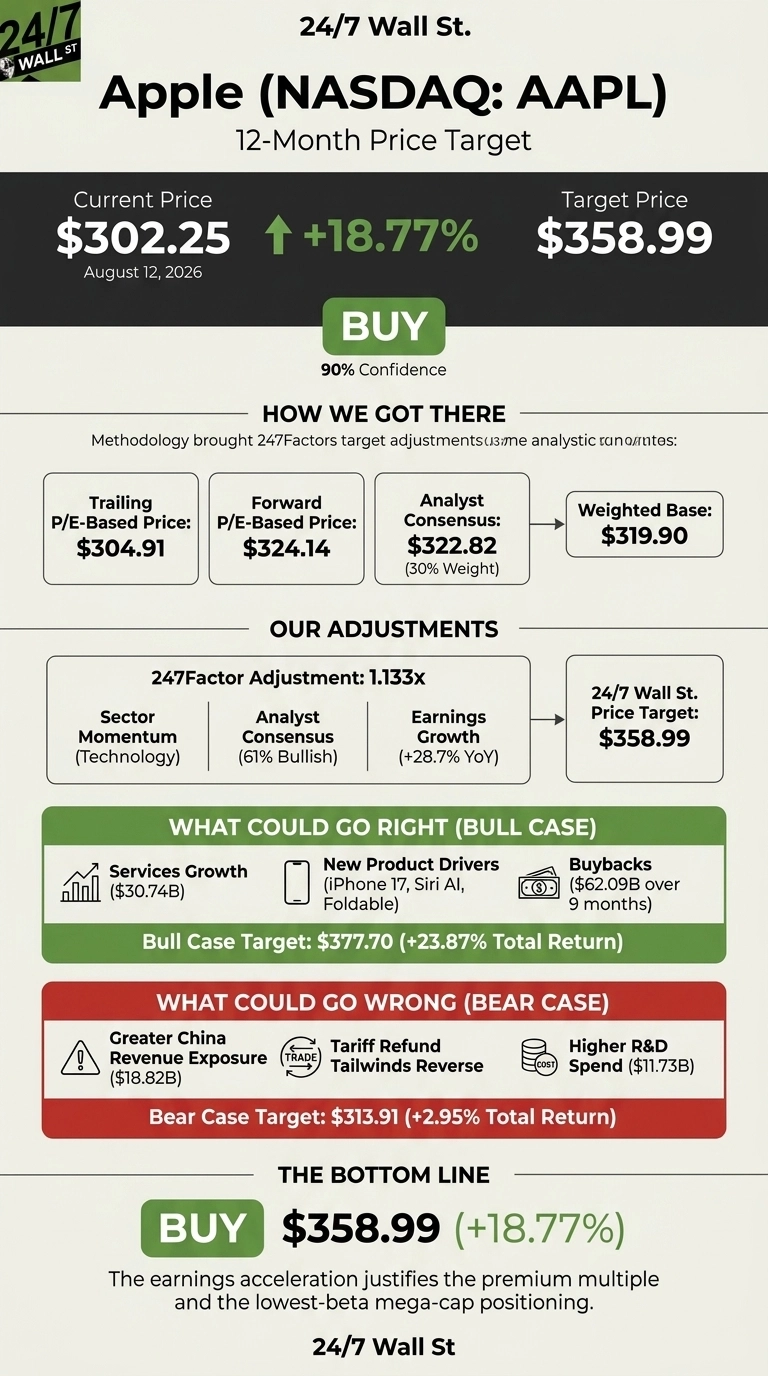
Our 24/7 Wall St. price target for Apple (NASDAQ: AAPL | AAPL Price Prediction) is $358.99, implying 18.77% upside from the $302.25 close on August 12, 2026. The model rates AAPL a buy at 90% confidence. With a beta of 1.086, Apple carries the lowest realized volatility profile of any $4 trillion-plus name.
24/7 Wall St. Price Target Summary
| Metric | Value |
|---|---|
| Current Price | $302.25 |
| 24/7 Wall St. Price Target | $358.99 |
| Upside | 18.77% |
| Recommendation | BUY |
| Confidence Level | 90% |
The Rally, the Pullback, and the Setup
Apple rallied 32.1% over the past year but pulled back 4.66% in the last month, leaving shares 6% below the 52-week high of $344.27. Year-to-date, AAPL is up 11.48%.
Fiscal Q3 revenue reached $109.42 billion, up 16.4% year-over-year, with EPS of $2.02 topping estimates by 6.8% for the ninth consecutive beat. Tim Cook called it the “strongest June quarter ever”, driven by iPhone and Services.
Recent sentiment has been mixed, with r/wallstreetbets running bullish while r/stocks focused on CXMT rejecting Apple’s memory pricing demands, a supply-chain issue that Polymarket assigns only a 30.5% probability of resolving in Apple’s favor.

Why Bulls See $378 and Higher
The bull case takes AAPL to $377.70, a 23.87% total return. Services hit $30.74 billion in the June quarter, a high-margin annuity expanding steadily. The iPhone 17 lineup is driving strong demand, and Polymarket puts a 89.5% probability on a foldable iPhone launching before 2027, a potential ASP uplift.
Apple unveiled an all-new Siri AI at WWDC26, arming the 2.5 billion active device installed base with on-device generative AI. Buybacks of $62.09 billion over nine months shrink the share count.

What Could Go Wrong
The bear case caps AAPL at $313.91, only 2.95% above spot. Greater China revenue of $18.82 billion remains exposed to trade friction, and Q3 gross margin benefited by roughly two percentage points from tariff refunds worth about $0.11 in EPS.
Strip that out and the beat looks less clean. Polymarket’s crowd assigns only a 4% probability to AAPL hitting $360 in August. R&D spend rose to $11.73 billion from $8.9 billion a year ago, reflecting investment in the Siri AI stack.

How Apple Compares to Microsoft and Alphabet
Microsoft (NASDAQ: MSFT) trades at a P/E of 27 with Azure growing 43% and Microsoft 365 Copilot at 30 million paid seats. Cloud growth outpaces Apple’s device cycles, but its multiple is lower, making Apple’s forward P/E of 32 look full.
Alphabet (NASDAQ: GOOGL) trades at a P/E of just 15 with Google Cloud accelerating to 82% growth and revenue up 24.2%. On pure numbers, GOOGL is cheaper and growing faster. Apple offers a beta of 1.086 and a $4.4 trillion capital return machine. The peer set makes our $358.99 target reasonable rather than aggressive.
Apple Price Prediction 2026-2030
Our 24/7 Wall St. price target of $358.99 rates AAPL a buy at 90% confidence. The bull thesis rests on Services growth staying in the mid-teens and the foldable iPhone timeline holding. The bear case builds if China revenue rolls over or tariff refund tailwinds reverse. The earnings acceleration justifies the premium multiple.

| Year | 24/7 Wall St. Price Target |
|---|---|
| 2026 | $358.99 |
| 2027 | $395 |
| 2028 | $435 |
| 2029 | $478 |
| 2030 | $521 |
These projections assume Apple compounds earnings in the low-to-mid teens and holds its premium multiple. Meaningful upside or downside could come from AI-driven device refresh cycles or a slowdown in Greater China.
Contact [email protected] for any questions or corrections.
Vandita Jadeja is a financial publisher with over a decade of experience writing about financial topics, including investment, savings, retirement, insurance and banking. Vandita is a Chartered Accountant who loves to debunk financial concepts for readers.
Her work has appeared on sites that include The Motley Fool, InvestorPlace, and Benzinga. She covers investing and focuses on stock picks and price prediction for 24/7 Wall St.
When not looking for the next stock investment opportunity, she can be found traveling, reading, chasing sunsets and enjoying her iced latte.