




Tesla (NASDAQ: TSLA | TSLA Price Prediction) and NVIDIA (NASDAQ: NVDA) just delivered post-earnings updates that frame the AI trade in opposite ways. Tesla is pitching a future of robots, robotaxis, and software fleets.
NVIDIA is already selling the picks and shovels at scale. Both stocks sit near the heart of every AI portfolio, yet the businesses behind the tickers look nothing alike right now.
One Quarter Sells Cars. The Other Sells the AI Factory.
Tesla’s Q1 FY2026 report came in light on top-line drama. Revenue rose to $22.38 billion, up 15.78% year over year, with EPS of $0.41 beating the $0.359 consensus. Automotive gross margin expanded to 21.1%, helped by lower material costs and one-time warranty and tariff gains. Services revenue jumped 42% as 1.28 million FSD subscribers signed on. Energy storage, once the bull narrative, fell 12% YoY. That is a soft patch the bulls would rather not discuss.

NVIDIA’s Q1 FY2027 was a different universe. Revenue hit $81.615 billion, up 85.23%, with Data Center alone at $75.246 billion. Networking revenue tripled, climbing 199% YoY. Non-GAAP gross margin held at 75.0%. CEO Jensen Huang called it “the largest infrastructure expansion in human history”, and the Q2 guide of $91 billion suggests the curve has not flattened.

Where the Valuation Math Stops Making Sense
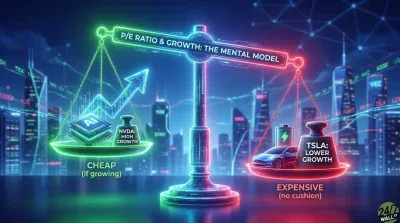
This is where the comparison gets uncomfortable for Tesla. NVIDIA carries a trailing P/E of 33 and a forward P/E near 25, with a PEG ratio of 0.663. Tesla trades at a trailing P/E of 384, a forward P/E of 204, and a PEG of 5.87. Operating margin tells the same story: 65.6% at NVIDIA versus 4.2% at Tesla.
| Lens | Tesla | NVIDIA |
| Revenue Growth YoY | 15.78% | 85.23% |
| Gross Margin | 18.0% | 75.0% |
| Forward P/E | 204 | 25 |
| Core Bet | Robotaxi, Optimus, FSD | Blackwell, Vera Rubin, networking |
Tesla’s premium leans entirely on products that have yet to ship in volume. Prediction markets give Tesla just a 9% chance of launching a California robotaxi by June 30, and only 15.5% odds on an Optimus release by year-end. That is the crowd signaling skepticism on the timeline even if the storyline holds.
The Catalysts That Actually Matter Next
NVIDIA returned $20 billion to shareholders in Q1 and authorized an additional $80 billion buyback. Supply commitments climbed to $119 billion. I will keep an eye on whether China export rules cap that trajectory, since the Q2 guide assumes zero Data Center compute revenue from China.

For Tesla, the next test is whether Cybercab, Tesla Semi, and Megapack 3 actually reach volume production in 2026, and whether energy storage stops bleeding.

Why I Lean Toward NVIDIA on This Quarter
If I had to allocate fresh capital today, NVIDIA is the easier defense. You are paying roughly 25 times forward earnings for a business growing revenue 85% with 65.6% operating margins and a fresh capital return program.
Tesla can still work for an investor who believes Optimus and unsupervised autonomy arrive on Elon Musk’s timeline, but I find the math hard to justify when the stock trades at 204 times forward earnings while growing in the mid-teens.
Director Kathleen Wilson-Thompson dumped 27,309 shares in the $369 to $384 range eight days after the beat. That is the behavior of an insider signaling the current price looks rich. Cybercab volume data or a meaningful pullback would be the kind of catalyst that could change the Tesla setup.
Contact [email protected] for any questions or corrections.






 Top Gaining Stocks
 Top Losing Stocks