The United States Natural Gas Fund (NYSEARCA:UNG) is the easiest way for a retail investor to bet on natural gas, and that convenience is exactly why holders have lost money on it for a decade. UNG trades near $11.33 today, down from $106.24 ten years ago. The decline is a story about how UNG is built: the fund holds front-month natural gas futures and rolls them every month, and the structure of the futures curve has been quietly eating shareholders alive.
What UNG actually owns
UNG is designed to track the daily price movement of Henry Hub natural gas. It does not store gas in tanks. It buys NYMEX natural gas futures, primarily the front-month contract, and as expiration approaches it sells that contract and buys the next month. The fund carries an expense ratio of 1.06% and roughly $508 million in assets. People hold it because they expect a winter cold snap, a hurricane in the Gulf, or a supply shock to push gas higher, and they want a clean, ticker-based way to express that view.
The roll yield trap
Natural gas futures almost always sit in contango, meaning the contract for next month trades higher than the one expiring now. When UNG rolls, it sells the cheap expiring contract and buys the more expensive next one. That spread is a real cost, paid every single month, and it does not require natural gas prices to fall for the fund to bleed.
A simple example: if the June contract is $2.80 and July is $2.95, the fund effectively buys fewer contracts for the same dollars. Repeat that drag twelve times a year and the math compounds against you. Industry roll-cost studies have pegged the annual structural drag at anywhere from 5% to north of 15%, depending on how steep the curve is. Add the expense ratio on top, and the fund has to fight a meaningful headwind just to stay flat.
The January 2026 proof
The clearest demonstration came this winter. Henry Hub spot gas spiked to $30.72 per MMBtu on January 23, 2026, a roughly tenfold jump from the prior month. By early February it had collapsed back near $5, and by May spot is sitting between $2.63 and $2.83. UNG is still down 7.59% year to date and 32.56% over the past year. Holders who bought to ride the spike captured almost none of it because front-month futures and spot are not the same instrument, and the roll losses kept compounding through the rally.
The equity alternative
The First Trust Natural Gas ETF (NYSEARCA:FCG) holds producers like EQT and Range Resources rather than futures, so there is no monthly roll. Over the same ten-year window UNG lost roughly 89%, FCG gained 66%. Same underlying commodity thesis, opposite outcome. FCG carries its own risks (equity beta, balance sheets, capex cycles), but it does not pay the contango tax.
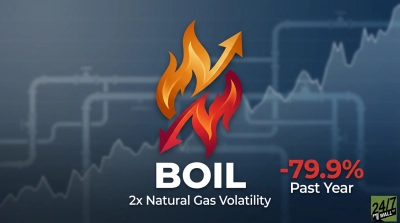
BOIL makes it worse
The ProShares Ultra Bloomberg Natural Gas (NYSEARCA:BOIL) layers 2x daily leverage on top of the same futures structure, which means contango costs are roughly doubled and daily compounding adds its own decay. The result: BOIL is down 99.45% over five years and effectively 99.98% over ten on a split-adjusted basis. It is a trading vehicle measured in days, suitable only for very short holding periods.
What to watch
- The NYMEX Henry Hub futures curve on the CME website. If the front three months are in steep contango, UNG’s roll cost will be heavy that month. Backwardation (curve sloping down) is rare but is when UNG actually earns positive roll yield.
- UNG performance versus spot Henry Hub over rolling 30-day windows. A persistent gap is the contango drag showing up in real time.
- UNG performance versus FCG. If you are bullish gas for more than a few weeks, the equity fund has historically been the cleaner expression.
The bottom line for holders
UNG is a legitimate tool for a short-term tactical bet on a specific catalyst, a storm, a pipeline outage, or a cold front in February. As a buy-and-hold position on natural gas, the structure works against you every month, regardless of where spot prices go. The 89% ten-year decline reflects what monthly rolling does to capital when the curve is shaped the way it almost always is.
Contact [email protected] for any questions or corrections.