Passive income is the rare line on a household balance sheet that does not care whether you showed up to work, whether the market opened green, or whether your employer is still hiring. It arrives on a schedule.
For income-focused investors, the appeal is concrete: it is the difference between a portfolio that has to be sold to fund retirement and one that funds it on its own. Dividend equities pull that off without the friction of rental tenants or the lockups of private credit.
Telecom is one of the few sectors built for this job. The infrastructure is laid, the cash flows are recurring, and the payouts are written into the capital allocation plan. Verizon (NYSE:VZ | VZ Price Prediction) sits at the top of that list, a Dow component with 20 consecutive years of dividend increases and a CFO who recently called the payout “ironclad.”
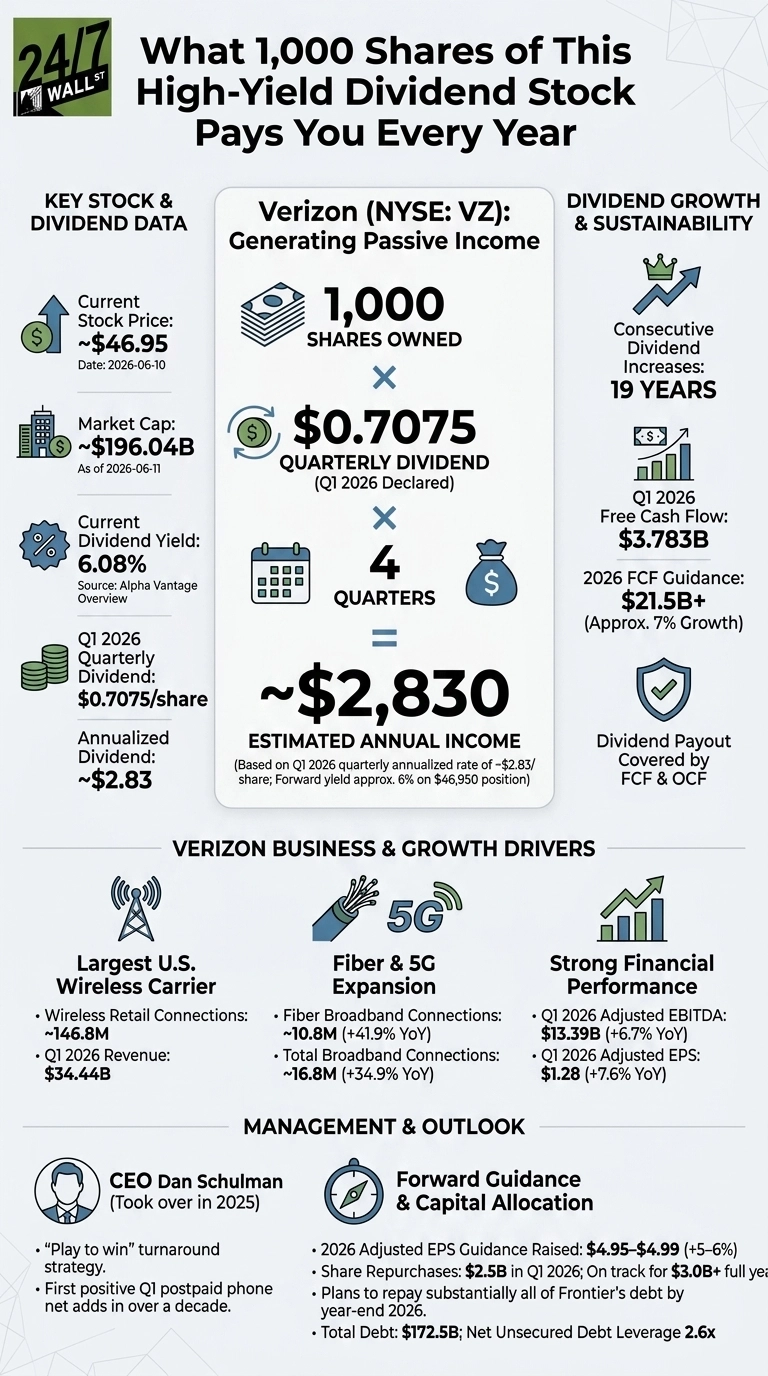
We screened our 24/7 Wall St. dividend equity research database for blue chips that turn a fixed share count into a meaningful annual paycheck, and Verizon stands out as a stock where just 1,000 shares can generate over $2,800 a year in passive annual income at the time of this writing.
Verizon: The Math on 1,000 Shares
- Current price: $46.95
- Yield: 6.08%
- Cost of 1,000 shares: $46,950
- Quarterly dividend: $0.7075
- Annual passive income: $2,830
The math is clean. At $0.7075 per share per quarter, 1,000 shares of Verizon produce $2,830 in annual dividend income, a forward yield of roughly 6% on a $46,950 position. That figure assumes the current quarterly rate holds for four payments. Given the streak, the next raise is more likely than not.
Why The Yield Is This High
Verizon is the largest U.S. wireless carrier, with roughly 146.8 million wireless retail connections and two reporting segments: Verizon Consumer at $26.45 billion in Q1 2026 revenue and Verizon Business at $7.42 billion.
The yield is structurally high because the business is mature, capital-intensive, and slow-growth. Spectrum, 5G, and fiber buildouts absorb capital that a faster-growing company would plow back into expansion. Verizon returns it to shareholders instead.
The dividend coverage backs that up. 2025 operating cash flow of $37.1 billion covered the $11.48 billion dividend payout roughly 3.2 times, with free cash flow covering it 1.75 times. Management guided 2026 free cash flow to $21.5 billion or more, an approximately 7% increase, leaving room for both the dividend and the restarted buyback.
What Has Changed Under New Leadership
CEO Dan Schulman, who took over in 2025, is running what he calls a “play to win” turnaround. Q1 2026 delivered adjusted EPS of $1.28, a 6.18% beat against the $1.2055 estimate, and the first positive Q1 postpaid phone net adds in 13 years. Management raised full-year adjusted EPS guidance to $4.95 to $4.99, implying 5% to 6% growth.
The Frontier Communications acquisition closed January 20, 2026, pushing fiber broadband connections up 41.9% year over year to roughly 10.8 million.
Verizon has paid down about half of Frontier’s debt and plans to retire substantially all of it by year-end, working toward a target leverage ratio of 2x to 2.25x by 2027 from 2.6x today. The company also completed $2.5 billion in Q1 buybacks, its first repurchase program in over a decade, with at least $3 billion planned for the full year.
Ownership And Insider Signal
Institutions hold 70.4% of the float, with Vanguard, BlackRock, and State Street historically the largest holders of a Dow staple like VZ. Insider activity skews to the buy side: CEO Schulman and the full C-suite, including CFO Anthony Skiadas, have added phantom stock units in every two-to-three-week window since March 2026, with no broad-based selling.
The Income Picture
One thousand shares of Verizon at $46.95 produce $2,830 in annual dividend income, a blended yield of roughly 6% on a $46,950 position. Skiadas put it plainly on the Q1 call: “The dividend is still ironclad for us, and we raised the dividend $0.07 back in January, and that’s the 20th consecutive year.”
The 19-to-20-year increase streak, combined with cash flow that covers the payout three times over, is what separates a yield like this from the kind that disappears when the next quarter disappoints. For investors who reinvest those quarterly checks, the share count grows on autopilot, and so does next year’s paycheck.
Contact [email protected] for any questions or corrections.