JEPI sells you monthly income. What it quietly sells away is your upside. Over the past five years, a $10,000 stake in the fund grew to roughly $14,479. The same $10,000 in plain S&P 500 exposure grew to roughly $17,858. That gap is the hidden cost of a fund marketed on its yield.
What You’re Actually Paying
JPMorgan’s headline price is the easy part. JPMorgan Equity Premium Income ETF (NYSEARCA:JEPI) carries a net expense ratio of 0.35%, with no fee waiver bringing it down from the gross figure of 0.35%. On a $10,000 position, that is $35 a year, every year, scraped off the top before a single distribution lands.
Compared to a low-cost dividend peer like Schwab U.S. Dividend Equity ETF (NYSEARCA:SCHD), which charges roughly 0.06%, the fee gap alone is about $29 per $10,000 per year. Over 20 years on a $100,000 position, that is real money diverted to the issuer. The expense ratio, though, is the smallest part of the bill.
The Part the Factsheet Doesn’t Highlight
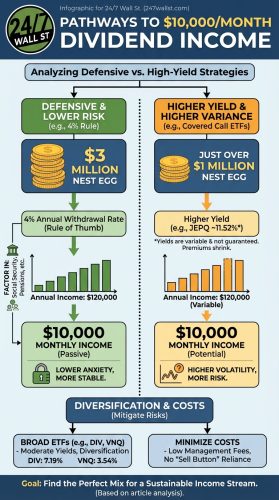
JEPI runs a covered-call overlay (it sells call options on its stocks for cash premium). That overlay caps gains when markets rally. The performance gap is clear: over the trailing year, JEPI returned 8.6% while the S&P 500 returned 24%. Over five years, JEPI gained 44.79% while the S&P 500 gained 78.58%. The forfeited upside dwarfs the 0.35% fee by an order of magnitude.
The income itself is less stable than the “monthly distribution” label suggests. In 2026, monthly payouts have swung from $0.34443 in February to $0.44761 in May, before sliding to $0.38921 in June. Look further back: distributions peaked at $0.6104 in December 2022 and bottomed at $0.2572 in August 2021. The “income” is option premium, and option premium shrinks when volatility shrinks.
Then comes the tax layer. A meaningful slice of those distributions is option premium taxed as ordinary income, not qualified dividends. For a retail holder in a taxable account, that means a higher annual tax bill on the income you actually receive, on top of giving up appreciation that would have been taxed only when sold, if ever. That is tax drag the factsheet does not score against the yield.
The Cheaper Mirror
Two alternatives expose the gap. For straight large-cap exposure, SPDR S&P 500 ETF Trust (NYSEARCA:SPY) gives you the index without an option overlay capping rallies. For dividend income from blue-chip payers like Bristol-Myers Squibb, Chevron, and Coca-Cola, SCHD delivered 24.11% over the trailing year and 54.75% over five years, with mostly qualified-dividend treatment. Neither replicates JEPI’s headline yield, and that is the point: you give up some monthly cash to stop paying the upside tax.
The overlap argument bites too. JEPI’s top holdings as of March 30, 2026 read like a tech index: NVIDIA at 7.9%, Apple at 6.4%, Alphabet at 6.4%, Microsoft at 5.0%, and Amazon at 4.8%. If you already own SPY or Invesco QQQ Trust (NASDAQ:QQQ), you are paying 0.35% to re-buy the same mega-caps, then paying again in capped upside when those names rip.
What This Means for You
JEPI pays. The real question is what the yield costs in foregone appreciation, ordinary-income tax, and overlap with index funds you may already hold. Before adding more, look at your last brokerage 1099, compare your JEPI total return to SPY since you bought, and ask whether monthly cash is worth the gap.
Contact [email protected] for any questions or corrections.