The American starter home, once a symbol of accessible homeownership, has crossed into seven-figure territory in a growing number of metros. According to Katie Hubbard, president of U.S. Capital Markets at Walton Global, 268 U.S. cities now have entry-level homes priced at $1 million, concentrated mostly in California and New York. According to Zillow, the number of U.S. cities where the typical starter home carries a $1 million price tag has climbed from 80 in 2020 to 268 today.
In a recent Bloomberg Businessweek segment, Hubbard, whose firm she describes as managing $4.4 billion in land assets across 90-plus countries, walked through why affordability continues to deteriorate even as builders are growing more confident in housing demand.
Why Builders Are More Optimistic Than Headlines Suggest
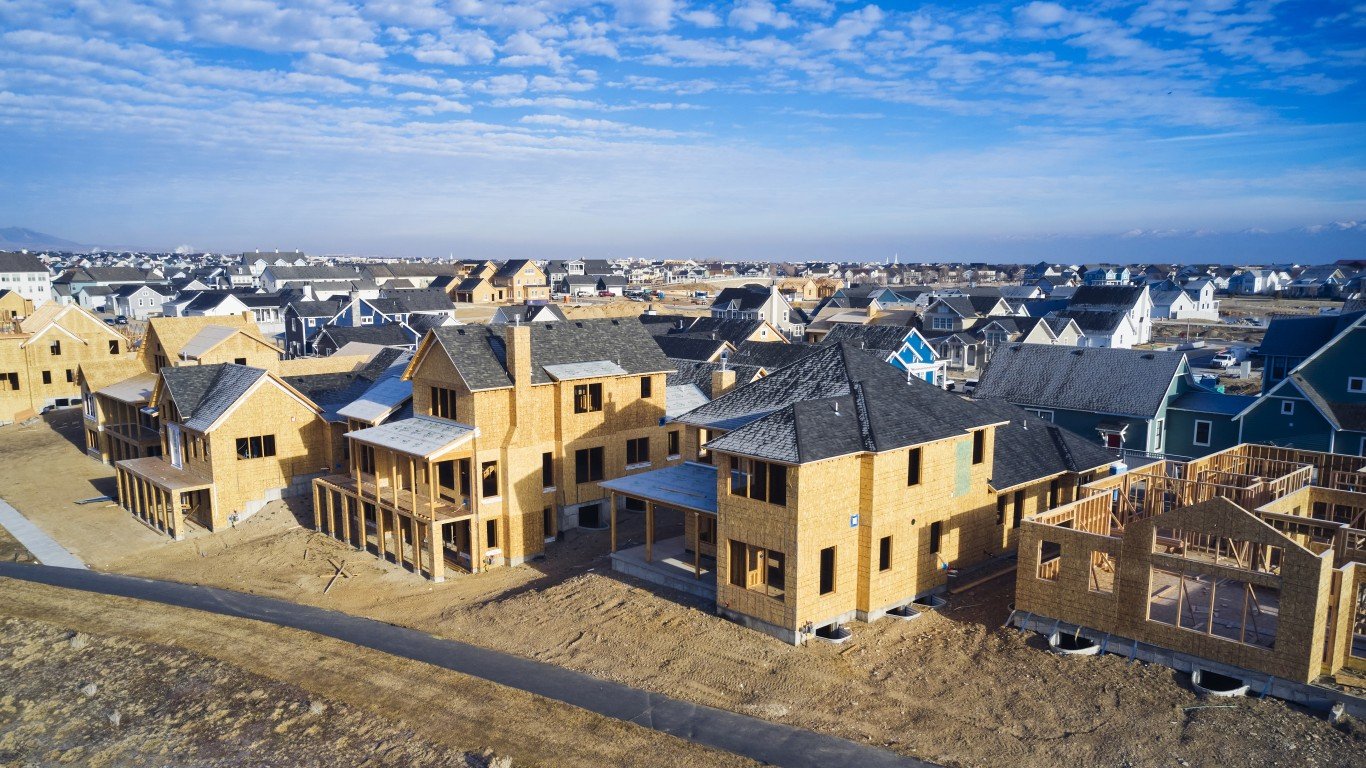
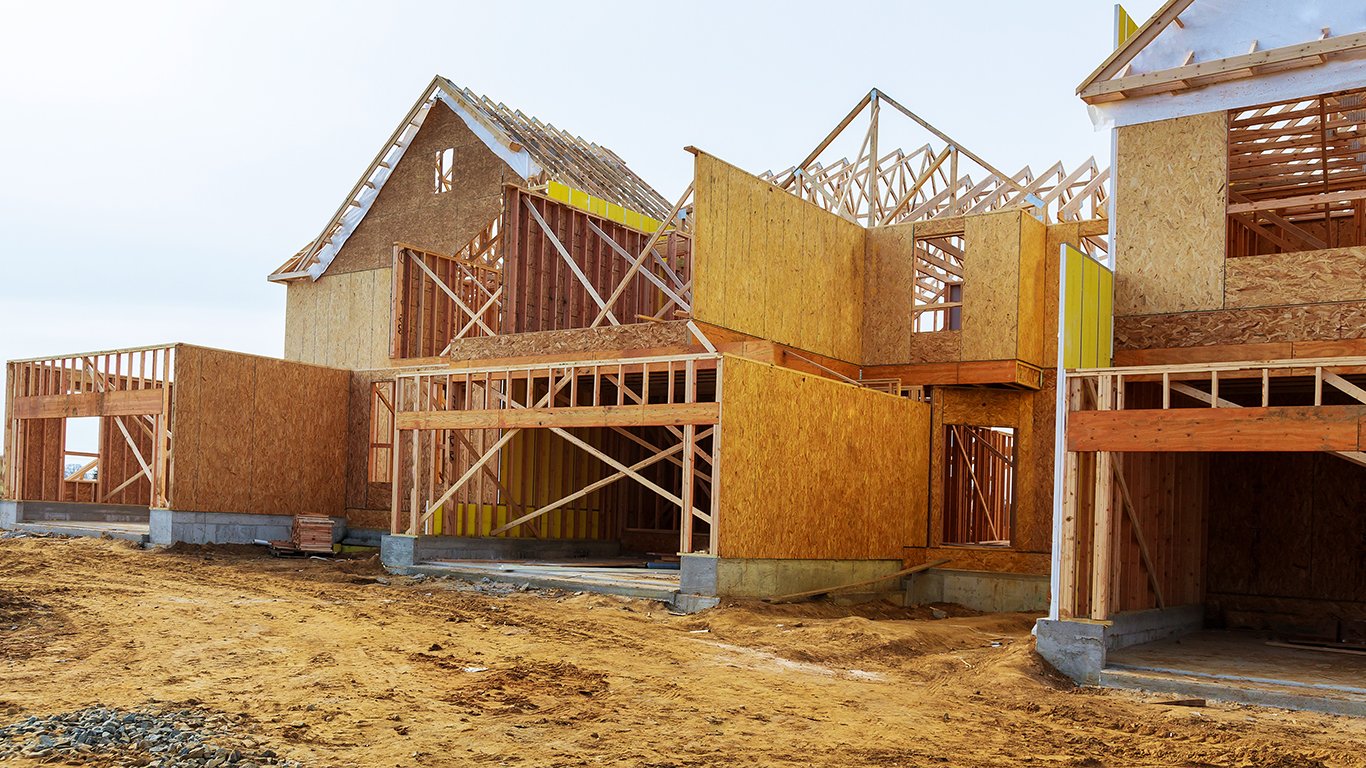
Hubbard argues homebuilders are more bullish than recent figures suggest. She pointed to new home sales of 583,000, down 7%, but noted builders are aggressively buying finished lots and shifting away from speculative building toward build-to-order. The result is fewer starts overall, with builders targeting buyers who can afford the monthly payment. She added that higher-end homes around $950,000 are selling well, often to cash buyers, which helps explain why median price points keep climbing while volumes soften.
On the regulatory side, Hubbard contends federal legislation has limited power to fix supply. She cited institutional investors owning less than 1% of single-family homes, down from a peak of 3% in 2022, a figure she says undermines a premise behind a bill Trump declined to sign.
The real bottleneck, in her view, is local zoning, where approvals can take 3-5 years and add thousands of dollars per home. Hubbard described that drag as “more significant to housing affordability than a 50 basis point rate cut.” She pointed to Texas, Florida, and the Carolinas dominating new construction thanks to lighter regulation.
How Lennar Is Navigating Today’s Housing Market
Hubbard singled out homebuilder Lennar (NYSE:LEN | LEN Price Prediction) as the clearest illustration of how big builders are responding, noting the company is delivering 20,000 homes per quarter by deliberately compressing margins to maintain volume.
In its Q2 fiscal 2026 report, Lennar posted revenue of $7.94 billion and EPS of $1.24, with gross margin on home sales of 15.6%, compressed from 17.8% a year earlier. Average sales price fell to $371,000, well below the $1 million starter-home benchmark Hubbard cited.
Lennar’s CEO, Stuart Miller, framed the trade-off directly: “Our strategy consistently has been to execute around the affordability challenge rather than wait it out. We have prioritized volume to create durable scale advantages, to deliver that volume at lower prices, and ultimately improve margins.” Lennar is leaning on buyer incentives, which are running at 12.9% versus a normalized range of 4% to 6%, alongside rate buydowns to keep monthly payments within reach.

Why Housing Affordability Remains Under Pressure
The challenges Hubbard described are visible across today’s housing market. The 10-year Treasury yield stood at 4.50% as of June 23, 2026, ranking in the 94th percentile over the past year and keeping mortgage rates elevated. On Lennar’s earnings call, CEO Stuart Miller said the average 30-year fixed mortgage rate remains between 6.4% and 6.5%.
At a 6.5% mortgage rate, he noted, a household earning the median family income is spending more than 30% of its gross income on housing. Meanwhile, consumer sentiment fell to 49.8 in April 2026, approaching recessionary territory, while housing starts declined to 1.18 million units in May, consistent with Hubbard’s view that builders are pulling back on speculative construction.
Homebuilders like Lennar illustrate both the opportunity and the challenge in this industry. The stock traded at $93.30 as of June 25, 2026, down 8.71% year-to-date and 15.24% over the past year, while trading at a trailing P/E of 14. The company continues to sacrifice margins to keep home sales moving, even as high mortgage rates, restrictive zoning, and weak consumer confidence weigh on affordability. Hubbard argues that local zoning reform, not federal legislation, will ultimately determine how quickly new housing supply can increase or whether the list of 268 U.S. cities with $1 million starter homes will continue to grow.
Contact [email protected] for any questions or corrections.