Salesforce vs ServiceNow: One Buys Back Shares, Other Buys Companies
Salesforce (NYSE:CRM | CRM Price Prediction) and ServiceNow (NYSE:NOW) both just delivered results that reset the enterprise AI conversation. Salesforce posted $11.13 billion in Q1 FY27 revenue on May 27, 2026, leaning on Agentforce and a massive buyback. ServiceNow closed…


Salesforce (NYSE:CRM | CRM Price Prediction) and ServiceNow (NYSE:NOW) both just delivered results that reset the enterprise AI conversation. Salesforce posted $11.13 billion in Q1 FY27 revenue on May 27, 2026, leaning on Agentforce and a massive buyback.
ServiceNow closed FY25 on January 28, 2026 with $3.568 billion in Q4 revenue and a wave of security-focused acquisitions. Two AI platforms, two very different playbooks.
Agentforce Carries Salesforce. Workflow M&A Carries ServiceNow.
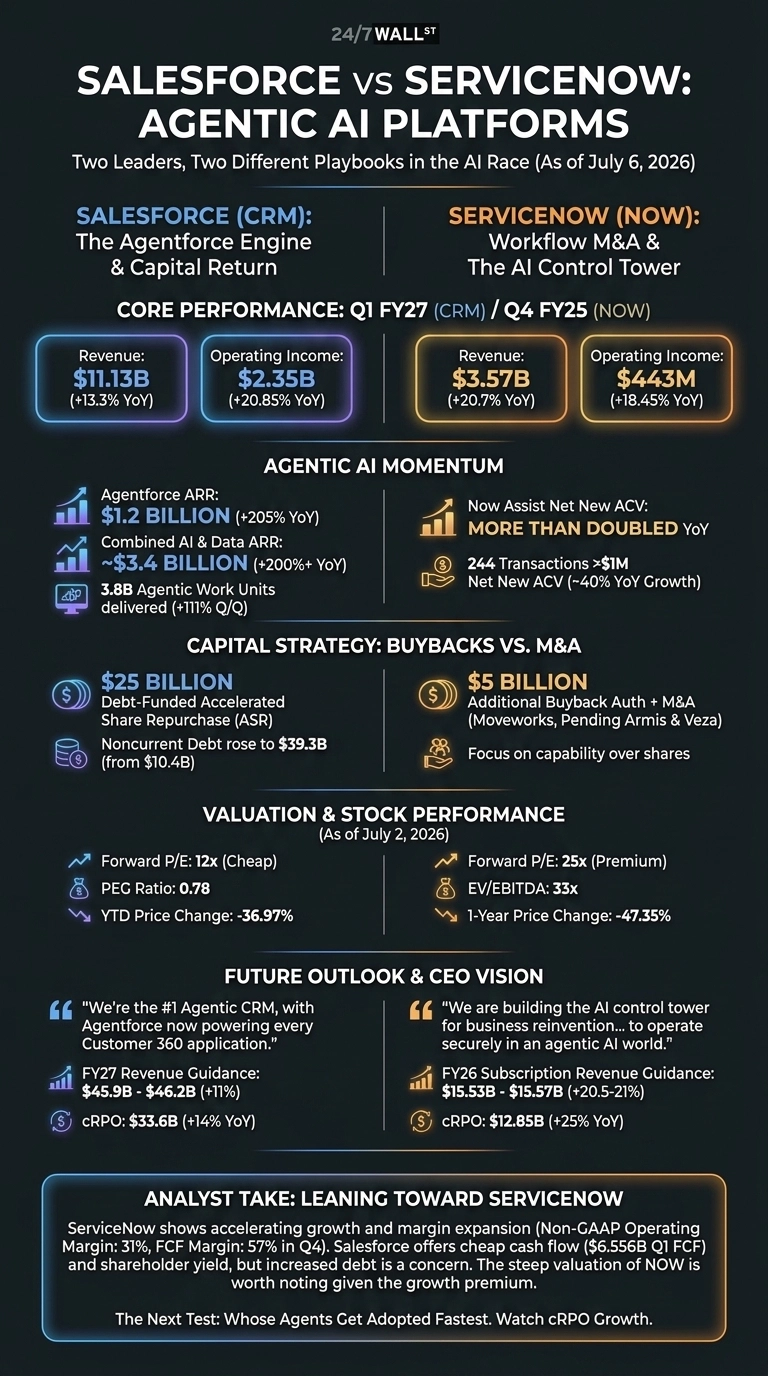
Salesforce is monetizing agents faster than most skeptics expected. Agentforce ARR hit $1.2 billion, up 205% year over year, and combined AI plus data ARR reached nearly $3.40 billion. Customers processed 3.8 billion Agentic Work Units, with more than 50% of Agentforce and Data 360 bookings coming from existing accounts. That is a healthy signal that Customer 360 remains sticky.

ServiceNow is playing a wider game. Now Assist net new ACV more than doubled year over year, and the platform closed 244 transactions above $1 million in net new ACV.
CEO Bill McDermott framed the mission bluntly: “We are building the AI control tower for business reinvention so enterprises can operate securely in an agentic AI world.” The Moveworks close, plus pending deals for Armis and Veza, push ServiceNow deeper into security and identity.

| Business Driver | Salesforce | ServiceNow |
| Growth Engine | Agentforce + Data 360 | Now Assist + workflow M&A |
| Revenue Growth | 13.3% YoY | 20.66% YoY |
| Capital Strategy | $25B debt-funded ASR | $5B buyback + acquisitions |
One Buys Back Stock. The Other Buys Companies.
Salesforce is defending its core with a very expensive fence. The $25 billion accelerated share repurchase cut diluted shares from 970 million to 871 million, but noncurrent debt jumped to $39.3 billion from $10.4 billion.
Benioff called it “an outstanding quarter”, yet investors have not been convinced: CRM is down 36.97% year to date. ServiceNow is spending on capability instead of shares, and it has bled harder, off 47.35% over the past year.
Valuation tells the tension. CRM trades at a forward P/E of 12x with a PEG of 0.779. NOW trades at a forward P/E of 25x and an EV/EBITDA of 33x. You pay up for the growth rate.
The Next Test Is Whose Agents Get Adopted Fastest
I will be watching cRPO. Salesforce guided FY27 revenue of $45.90 billion to $46.20 billion, with cRPO at $33.6 billion, up 14%.

ServiceNow guided FY26 subscription revenue of $15.53 to $15.57 billion with cRPO growth of 22.5%. If McDermott’s “AI-driven CRM” language turns into real wins against Customer 360, the growth gap widens. Reddit already smells the fight: a viral investing thread framed Salesforce’s Informatica buy as proof the disruption is real.

Why I Lean Toward ServiceNow, But Only Just
If you want cheap cash flow and a shareholder yield story, Salesforce fits. A PEG under 0.8 and $6.556 billion in Q1 free cash flow are hard to ignore, and the $0.42 quarterly dividend adds a floor. My hesitation is the debt: leveraging up to buy your own stock while a competitor targets your customers is a defensive move dressed as confidence.
I lean toward ServiceNow for the next 18 months because growth is accelerating while margins expand. Non-GAAP operating margin reached 31%, FCF margin hit 57% in Q4, and the Armis and Veza deals give the platform something Salesforce lacks: a credible security layer for agentic workflows.
The valuation is steep, which is worth noting given the growth premium. If Agentforce bookings decelerate next quarter, I revisit the whole thesis.
Contact [email protected] for any questions or corrections.
Vandita Jadeja is a financial publisher with over a decade of experience writing about financial topics, including investment, savings, retirement, insurance and banking. Vandita is a Chartered Accountant who loves to debunk financial concepts for readers.
Her work has appeared on sites that include The Motley Fool, InvestorPlace, and Benzinga. She covers investing and focuses on stock picks and price prediction for 24/7 Wall St.
When not looking for the next stock investment opportunity, she can be found traveling, reading, chasing sunsets and enjoying her iced latte.