AMC Stock After Record Earnings: Buy, Sell, or Hold?
AMC just posted the strongest quarter in its 106-year history, and the stock still has Wall Street's consensus pointing the wrong direction. Here is why that contradiction tells you exactly what to do next.

After a jaw-dropping earnings beat and same-day surge, AMC Entertainment (NYSE:AMC) at $2.46 is a hold. The record quarter is real, but the balance sheet still isn’t, and Wall Street’s target sits below the current price.
AMC runs the largest theatrical exhibition footprint in the world, with roughly 850 theatres and 9,500 screens across the U.S. and Europe under the AMC and Odeon brands. The stock has spent five years working off a meme-driven melt-up and enters this discussion after the strongest operating quarter in its 106-year history.
What brought AMC to $2.46 is a genuine box office recovery. Domestic industry gross reached roughly $2.99 billion, the biggest quarter in seven years, and AMC’s shares jumped 26.8% on the earnings report.
The Bull Case: Operating Leverage Is Finally Working
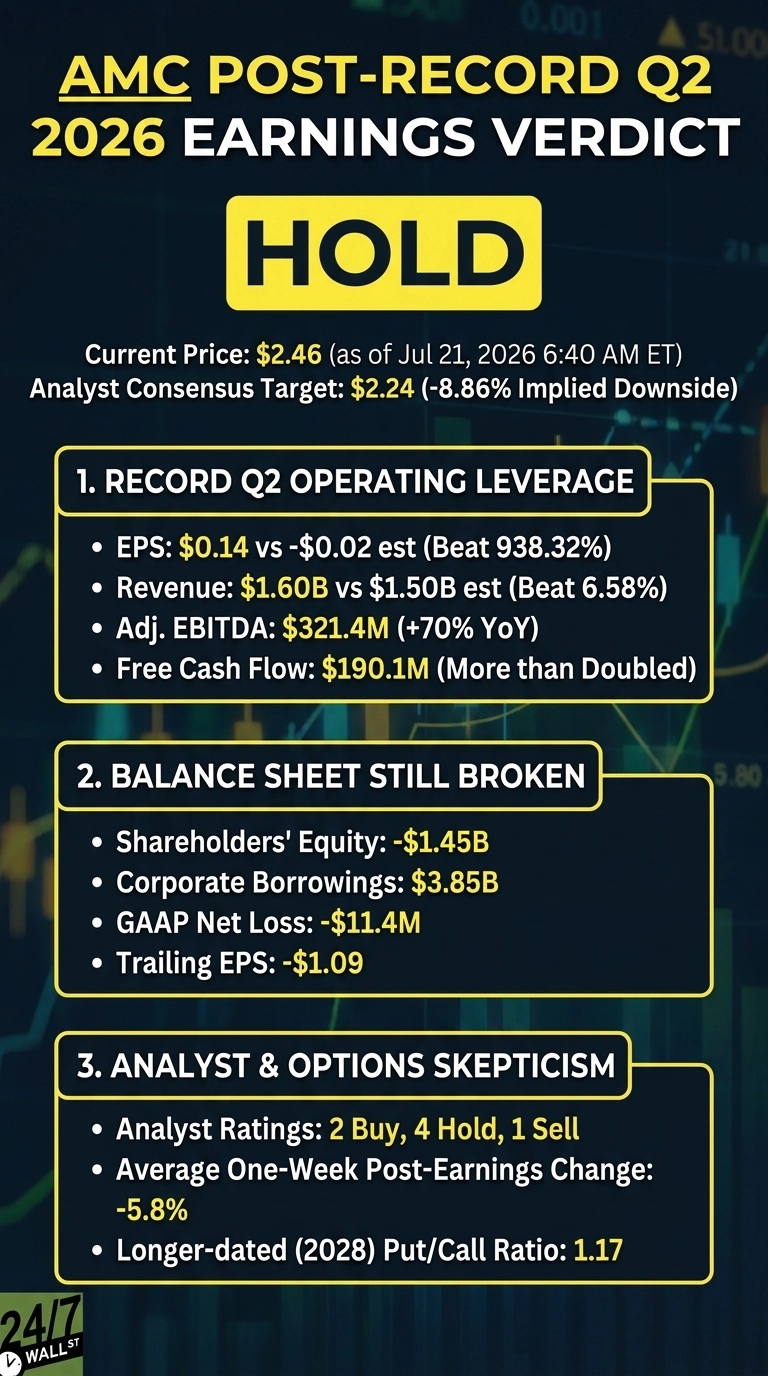
Q2 was extraordinary across all operational lines. Revenue rose 14.22% year over year to $1.6 billion, EPS of $0.14 obliterated a $(0.0167) estimate, and adjusted EBITDA soared 70% to $321.4 million. Free cash flow more than doubled to $190.1 million, and international adjusted EBITDA jumped 336.7%.

The slate ahead is stacked. THE ODYSSEY already delivered a $124 million opening, with SPIDER-MAN: BRAND NEW DAY, DUNE: PART THREE, AVENGERS: DOOMSDAY still to come.
Refinancing cut $16 million of annual interest, with leverage-triggered rate cuts on roughly 75% of debt expected to save another $51 million per year. CEO Adam Aron called the quarter “nothing short of extraordinary”.
The Bear Case: The Balance Sheet Is Still Broken
Even after the record quarter, AMC posted a GAAP net loss of $(11.4) million, carries $3,851.6 million in corporate borrowings, and reports shareholders’ equity of $(1,452.7) million. Trailing EPS remains -$1.09, and forward P/E sits at 122x.
Post-earnings history is unkind. Across the last six reports, AMC’s average one-week change is -5.8%, and prior beats have repeatedly faded. Dilution from equity offerings and exchangeable notes, plus shrinking theatrical windows and tariff/AI risks, keep the structural bear thesis alive.
The Hold Case: A Great Quarter Meets A Skeptical Consensus
Operations are inflecting while the capital structure hasn’t caught up. The consensus target of $2.242 sits -8.86% below spot. A durable rerating requires more quarters like this one.
Options positioning offers nuance. The full-chain put/call ratio is bullish at 0.27, but longer-dated 2028 contracts skew to 1.17, hinting at longer-term hedging.
What The Tape And Consensus Say
AMC trades at $2.46 against a Wall Street average target of $2.242, implying roughly 8.9% downside. Coverage skews cautious: 2 Buy, 4 Hold, and 1 Sell ratings.
The stock is up 57.69% year to date and jumped 31.55% in the past week. Over one year, shares are down 30.51%, and over five years down 99.4%, while the S&P 500 has posted double-digit gains over the same one-year window.
The Verdict: Waiting For Confirmation
At $2.46, AMC Entertainment is a hold.
The bull case needs proof of repeatability. One record quarter after FY2025 EPS of -$1.34 and free cash flow of -$365.9 million is a data point, not a trend. Until Q3 confirms operating leverage sticks as the slate normalizes, paying up here means betting that the best box office quarter in seven years becomes the new baseline.
The bear case has already been partially priced in. Shares are down sharply over one and five years, forward P/E is stretched, and the analyst target implies mid-single-digit downside rather than a cliff. Selling into a genuine EBITDA inflection and stacked back-half slate risks missing a rerating if debt costs fall as guided.
Watch for another quarter of double-digit revenue growth and positive free cash flow, which would tip this toward Buy. A Q3 miss, further dilution, or stalled slate would tip it to Sell. Patience costs little when consensus already sees downside, and it buys the confirmation this thesis lacks.
AMC has earned the benefit of the doubt on operations, but not yet on its balance sheet, and that gap is exactly what a Hold rating prices.
Contact [email protected] for any questions or corrections.
Vandita Jadeja is a financial publisher with over a decade of experience writing about financial topics, including investment, savings, retirement, insurance and banking. Vandita is a Chartered Accountant who loves to debunk financial concepts for readers.
Her work has appeared on sites that include The Motley Fool, InvestorPlace, and Benzinga. She covers investing and focuses on stock picks and price prediction for 24/7 Wall St.
When not looking for the next stock investment opportunity, she can be found traveling, reading, chasing sunsets and enjoying her iced latte.