Prediction: ServiceNow’s AI Business Just Crossed $1 Billion. Here’s What It Means For the Stock
ServiceNow just posted a blowout quarter with AI deployments scaling at a pace no enterprise software company has matched, yet the stock sits 50% below where it traded a year ago. Something about that gap does not add up.

ServiceNow (NYSE:NOW | NOW Price Prediction) just did something no enterprise software company has done at this pace: its AI business crossed $1 billion in annual contract value, with agentic deployments up ninefold in nine months. Yet the stock trades down 50.4% over the past year. Our 24/7 Wall St. price target says that disconnect is the opportunity.
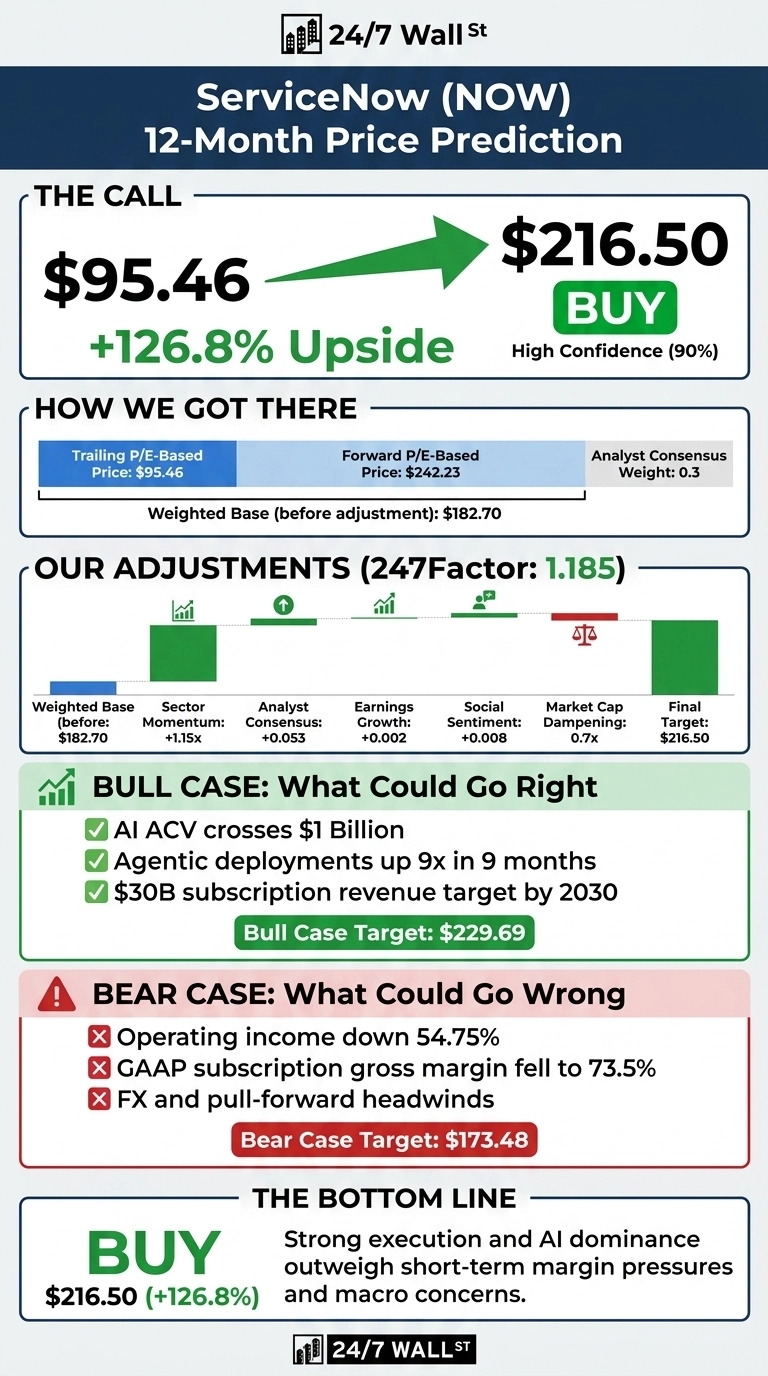
The price target for ServiceNow is $216.50 over the next 12 months, implying 126.8% upside from the current $95.46. Our model registers a bullish signal with 90% confidence.
| Metric | Value |
|---|---|
| Current Price | $95.46 |
| 24/7 Wall St. Price Target | $216.50 |
| Upside | 126.8% |
| Recommendation | BUY |
| Confidence Level | 90% |
Why the Stock Sold Off Into a Blowout Quarter
ServiceNow is down 37.69% year to date and off 8.85% in the past week, sitting 33% below its 52-week high of $210.20. Q2 FY2026 delivered EPS of $0.90 versus $0.8564 estimated and revenue of $3.987 billion, up 24% year over year. Subscription revenue grew 24.5%, and total RPO hit $29 billion.
CEO Bill McDermott stated: “ServiceNow’s exceptional Q2 results solidify our position as the fastest-growing major enterprise software and cybersecurity company.” Management raised FY2026 subscription revenue guidance to $15.76 billion to $15.78 billion. The selling reflects sector-wide multiple compression across software while company execution remains strong.

Why Bulls See a Breakout Ahead
The bull case rests on the AI Control Tower becoming the governance layer for enterprise agentic AI. ServiceNow closed 123 net new ACV deals over $1 million (up nearly 40% year over year) and now has 658 customers spending more than $5 million ACV. Partnerships with NVIDIA (NASDAQ:NVDA) on Project Arc, Anthropic on Action Fabric, and nearly all 50 US states running the ServiceNow AI Platform reinforce the moat.
The consensus analyst target of $141.64, backed by 43 buy or strong buy ratings against a single sell, implies substantial upside. Our bull scenario reaches $229.69 if margin expansion and AI attach rates continue. Management targets $30 billion in subscription revenue by 2030, with AI reaching 30% of ACV.

What Could Go Wrong
Operating income fell 54.75% year over year to $162 million, and GAAP subscription gross margin fell to 73.5% from 80%. This reflects amortization from Armis and Veza acquisitions; free cash flow still grew 20.53% to $634 million. Non-GAAP operating margin guidance holds at 31.5% for FY2026.
Q2 benefited from a US Federal on-premise pull-forward from Q3, and Q3 faces a $35 million FX headwind on cRPO. Our bear scenario lands at $173.48.
How ServiceNow Compares to Salesforce and Workday
Salesforce (NYSE:CRM) trades at a P/E of 18 with Q1 FY27 revenue growth of 13.3%. ServiceNow grows subscription revenue at nearly twice that pace, yet its market cap of $98 billion trails Salesforce’s $133 billion. That gap makes our target conservative.
Workday (NASDAQ:WDAY) trades at a P/E of 38 while growing subscription revenue 14.3% year over year, slower than ServiceNow’s 24.5%. Investors pay a premium for slower growth at Workday, reinforcing that ServiceNow’s multiple has room to re-expand.
ServiceNow Price Prediction 2026-2030
The 24/7 Wall St. price target of $216.50 reflects a company growing 24% with an AI business scaling ninefold, trading like a slower-growth peer. The setup favors investors who can tolerate volatility on the road to Rule of 60. Stay on the sidelines only if enterprise software multiples compress further from macroeconomic shocks.

Our 24/7 Wall St. price target model projects ServiceNow could trade as follows, assuming AI monetization ramp and $30 billion subscription revenue target by 2030 stay on track.
| Year | 24/7 Wall St. Price Target |
|---|---|
| 2026 | $216.50 |
| 2027 | $310 |
| 2028 | $450 |
| 2029 | $630 |
| 2030 | $910 |
These projections assume ServiceNow executes on AI Control Tower adoption and margin discipline. Significant downside could result from a broader software multiple reset or slower enterprise AI monetization than management guides.
Contact [email protected] for any questions or corrections.
Vandita Jadeja is a financial publisher with over a decade of experience writing about financial topics, including investment, savings, retirement, insurance and banking. Vandita is a Chartered Accountant who loves to debunk financial concepts for readers.
Her work has appeared on sites that include The Motley Fool, InvestorPlace, and Benzinga. She covers investing and focuses on stock picks and price prediction for 24/7 Wall St.
When not looking for the next stock investment opportunity, she can be found traveling, reading, chasing sunsets and enjoying her iced latte.