AppLovin Grows 53% and Beats on Profit. Here’s Why We’re Bullish.
AppLovin just posted its fourth straight earnings beat while the stock sits nearly 40% below its peak, and the tension between that contradiction points to something unusual happening inside this business.

This post may contain links from our sponsors and affiliates, and Flywheel Publishing may receive compensation for actions taken through them.

AppLovin (NASDAQ: APP | APP Price Prediction) delivered strong results. Revenue accelerated to $1.92 billion, up 52.82% year over year, GAAP EPS of $3.76 topped the $3.7549 consensus, and adjusted EBITDA margin expanded to 84%.
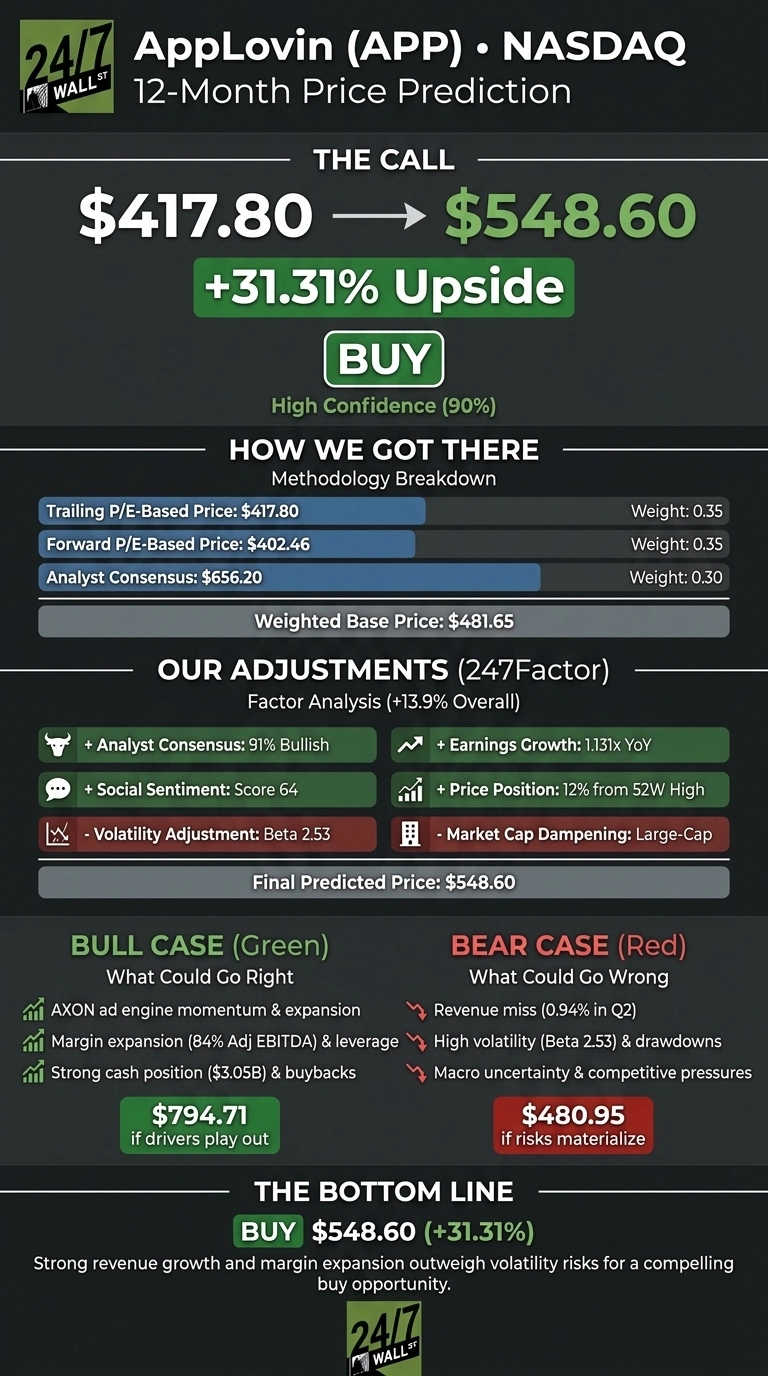
Our 24/7 Wall St. price target for APP is $548.60, implying 31.31% upside from the current $417.80. We rate APP a buy with high confidence.

24/7 Wall St. Price Target Summary
| Metric | Value |
|---|---|
| Current Price | $417.80 |
| 24/7 Wall St. Price Target | $548.60 |
| Upside | 31.31% |
| Recommendation | BUY |
| Confidence Level | 90% |
Why APP Trades Well Below Its December Peak
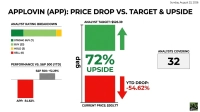
APP is down 38% year to date and 23.17% in the past month after peaking near $677.30 in December 2025. The stock bounced 4.59% in the past week and sits about 12% below the 52-week high of $745.61.
Q2 marked the fourth consecutive GAAP EPS beat, with operating income climbing 56.03% and net income rising 54.54%. Management guided Q3 revenue to $2.055 billion to $2.085 billion, extending the acceleration.
The Case for $794 and Beyond
Bulls see the AXON advertising engine in early innings. Adjusted EBITDA margins expanded from 81% to 84% in a single year, R&D more than doubled to $99.9 million, and cash on the balance sheet jumped 156% to $3.05 billion. AppLovin repurchased $551.3 million of stock in Q2.
Analyst distribution is heavily positive: 7 Strong Buys, 22 Buys, 3 Holds, zero sells, with a consensus target of $656.20. In the bull scenario, APP reaches $794.71 over the next 12 months as margin expansion and non-gaming ad verticals extend operating leverage.

What Could Go Wrong
Q2 revenue narrowly missed the $1.94 billion consensus by 0.94%, and prediction markets that priced in an 86.3% probability of a beat resolved No. The stock trades at a P/E of 36 with a beta of 2.53, leaving it vulnerable to sentiment swings, as the 38% YTD drawdown demonstrates.
Bulls counter that the revenue miss is trivial against 52.82% growth, and heavy R&D spend reflects reinvestment driving 84% EBITDA margins. Our bear scenario lands at $480.95, above today’s price.

How AppLovin Compares to Meta and Trade Desk
Meta Platforms (NASDAQ: META) is the closest scaled ad-tech comparison. Meta trades at a P/E of roughly 28 with operating margins near 42%. AppLovin commands a richer multiple, but with operating margins of 75.75% and net margins of 60.83%, the premium looks earned.
The Trade Desk (NASDAQ: TTD) is a direct programmatic ad-tech peer. Trade Desk trades at a P/E near 45, but Q1 2026 revenue growth decelerated to 17%, a fraction of AppLovin’s 52.82% pace. The valuation gap makes sense once growth and margins are layered in, and it makes our $548.60 target look reasonable.
| Company | P/E | Operating Margin |
|---|---|---|
| AppLovin | 38 | 75.75% |
| Meta | 28 | 42% |
| Trade Desk | 45 | 15% |
The Bull Case Summary
The 24/7 Wall St. price target of $548.60 with 31.31% upside and 90% confidence reflects a business compounding revenue north of 50% while pushing EBITDA margins into the mid-80s.
The setup rewards investors who can tolerate a beta of 2.53 and the drawdowns that come with it. APP has swung between $359 and $745.61 in the past year. On fundamentals, this is a buy.
| Year | 24/7 Wall St. Price Target |
|---|---|
| 2026 | $469.00 |
| 2027 | $548.60 |
| 2028 | $641.04 |
| 2029 | $749.05 |
| 2030 | $875.27 |
These projections assume AppLovin sustains double-digit earnings growth and its 84% adjusted EBITDA margin profile. Upside could come from non-gaming ad expansion; downside risk stems from ad market cyclicality and multiple compression on a stock with a beta above 2.5.
Contact [email protected] for any questions or corrections.
Vandita Jadeja is a financial publisher with over a decade of experience writing about financial topics, including investment, savings, retirement, insurance and banking. Vandita is a Chartered Accountant who loves to debunk financial concepts for readers.
Her work has appeared on sites that include The Motley Fool, InvestorPlace, and Benzinga. She covers investing and focuses on stock picks and price prediction for 24/7 Wall St.
When not looking for the next stock investment opportunity, she can be found traveling, reading, chasing sunsets and enjoying her iced latte.