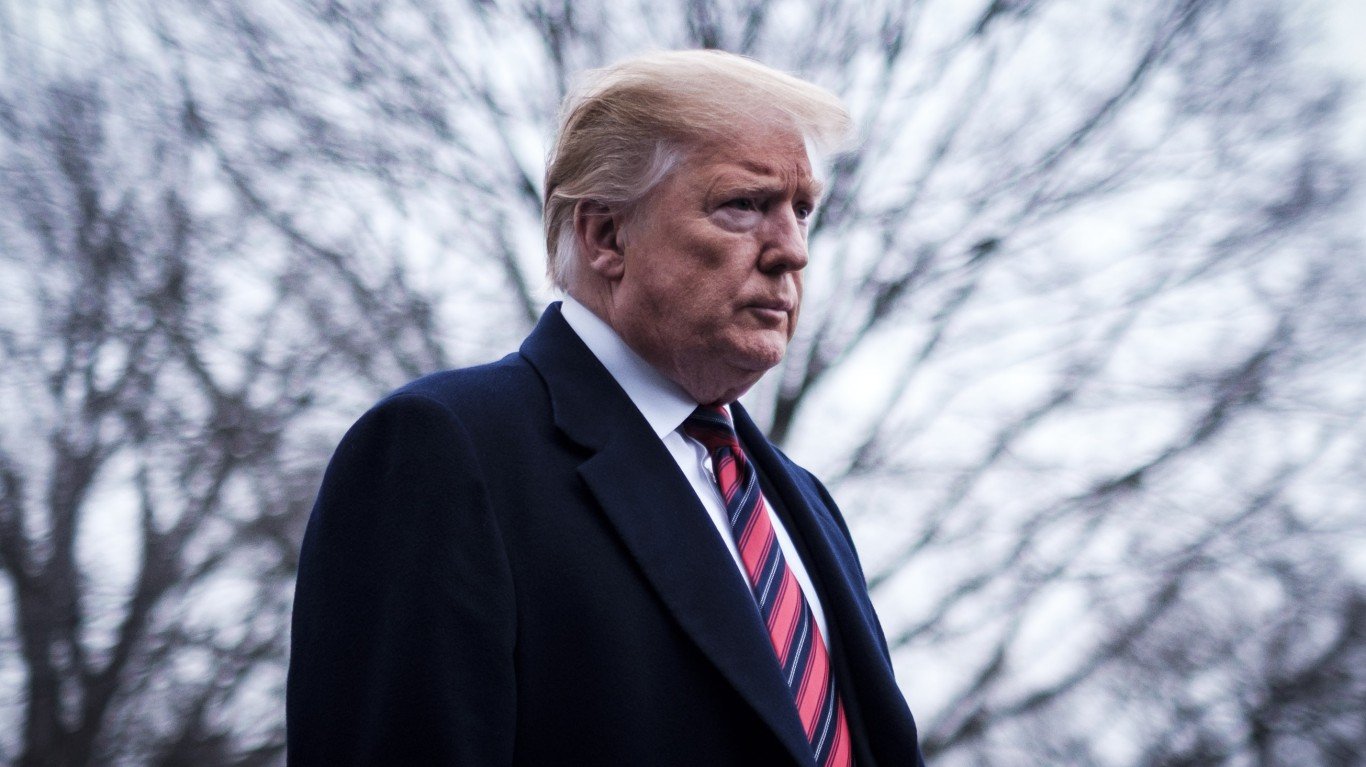
Trump Media (DJT) Stock Is Sliding Today: What’s Behind the Drop?
DJT shares are taking another hit while the broader market climbs, and the pile of political and regulatory pressure building against Trump Media suggests today's drop may be the least of shareholders' worries.

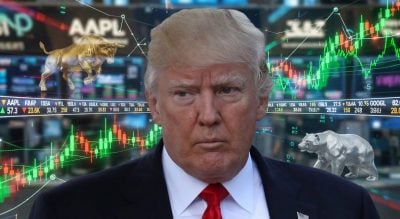
Shares of Trump Media & Technology Group (NASDAQ:DJT) are sliding again, falling 7.83% in the most recent trading session to $9.41. The move extends a rough stretch for a stock that is down 22.89% year to date and 40.4% over the past year, even as the S&P 500 sits near record territory.
No Single Catalyst, but the Backdrop Keeps Getting Heavier
Today’s decline lacks a confirmed same-day trigger, but a mounting overhang explains the pressure. Trump Media launched its “Truth API” on August 1, 2026, selling Wall Street firms real-time access to Truth Social posts for up to $100,000 per month. The product immediately drew bipartisan pushback, with Senators Elizabeth Warren and Adam Schiff formally requesting an SEC investigation on July 29 into potential insider-trading and market-manipulation concerns.
Senate Democrats then introduced S.5221, the Stop Corrupt Trading Act, which explicitly targets the Truth API structure and proposes federal criminal fines and potential prison sentences for sellers of nonpublic information via presidential-owned platforms. Coverage sentiment has been overwhelmingly negative: of 50 articles analyzed between July 17 and August 5, 18 were labeled Bearish and 13 Somewhat-Bearish, versus only 2 Bullish.
Fundamentals compound the pressure. Q1 2026 revenue was just $900,000, while the company posted a net loss of $405.88 million, driven largely by $368.7 million in unrealized losses on digital assets and equity securities. The stock trades at a price-to-sales ratio of 757 with a beta of 4.107, which helps explain why single-day moves land this hard.
Peers Are Holding Steady While DJT Slides
Today’s slide looks isolated. The VIX sits at 15.15, deep in complacency territory, and SPDR S&P 500 ETF Trust (NYSEARCA:SPY) is up 0.08% in the session. Social and alt-media peers are broadly higher or flat, suggesting the selling in DJT is stock-specific rather than sector-driven.
| Ticker | Company | Today | 1-Week | 1-Month | Market Cap |
|---|---|---|---|---|---|
| DJT | Trump Media | -7.83% | +3.55% | +20.26% | $2.83B |
| RUM | Rumble (NASDAQ:RUM) | -0.86% | +9.33% | +1.67% | $1.76B |
| META | Meta Platforms (NASDAQ:META | META Price Prediction) | +1.70% | +6.36% | -1.83% | ~$1.33T |
| RDDT | Reddit (NYSE:RDDT) | -1.33% | +14.95% | -17.21% | ~$23.3B |
Rumble, the closest thematic peer in alt-media, is essentially flat on the day. Meta is green. Reddit is softer but still meaningfully higher over the past week. That pattern points the finger back at DJT-specific overhang: the Truth API blowback, potential SEC scrutiny, S.5221 risk, and a valuation the market has been steadily marking down. Composite sentiment on DJT reads 40.48, neutral with medium confidence, and news component scoring is 38.95.
What to Watch Next
The near-term catalysts are political and regulatory rather than operational. Watch progress on S.5221, any formal SEC response to the Warren-Schiff letter, and Truth API subscriber adoption beyond the five firms reported by WSJ. On the chart, the 50-day moving average of $8.81 is the level bulls need to defend to keep the recent monthly uptrend intact.
Contact [email protected] for any questions or corrections.
Eric Bleeker, CFA has been investing for more than 20 years. He began his career working at Microsoft before joining Motley Fool, one of the largest publishers of financial research. In his 15 years at Motley Fool Eric served as the General Manager for Fool.com and led coverage in the Technology & Telecom sector. In addition, he was a featured columnist and has hosted dozens of investing seminars attended by more than a million total investors. Eric has more than 1,000 financial bylines to his name and has been featured in The Wall Street Journal, CNBC, Fox Business, and many other leading publications. He is currently focused on artificial intelligence investing and is a CFA Charterholoder.