I’ve Been Buying Fidelity’s Gigantic FXAIX Fund For Six Years Straight Before Realizing The True Cost
Six years of automated monthly purchases into one of the world's largest index funds felt like a smart, low-cost habit until a closer look at what taxable account holders actually owe each December changed the math entirely.


I’ve been buying Fidelity’s gigantic FXAIX fund every month for six years straight. You can see the first purchase in March, 2020. But, this was the first time I sat down to review the cost of Fidelity’s fund compared to other options.
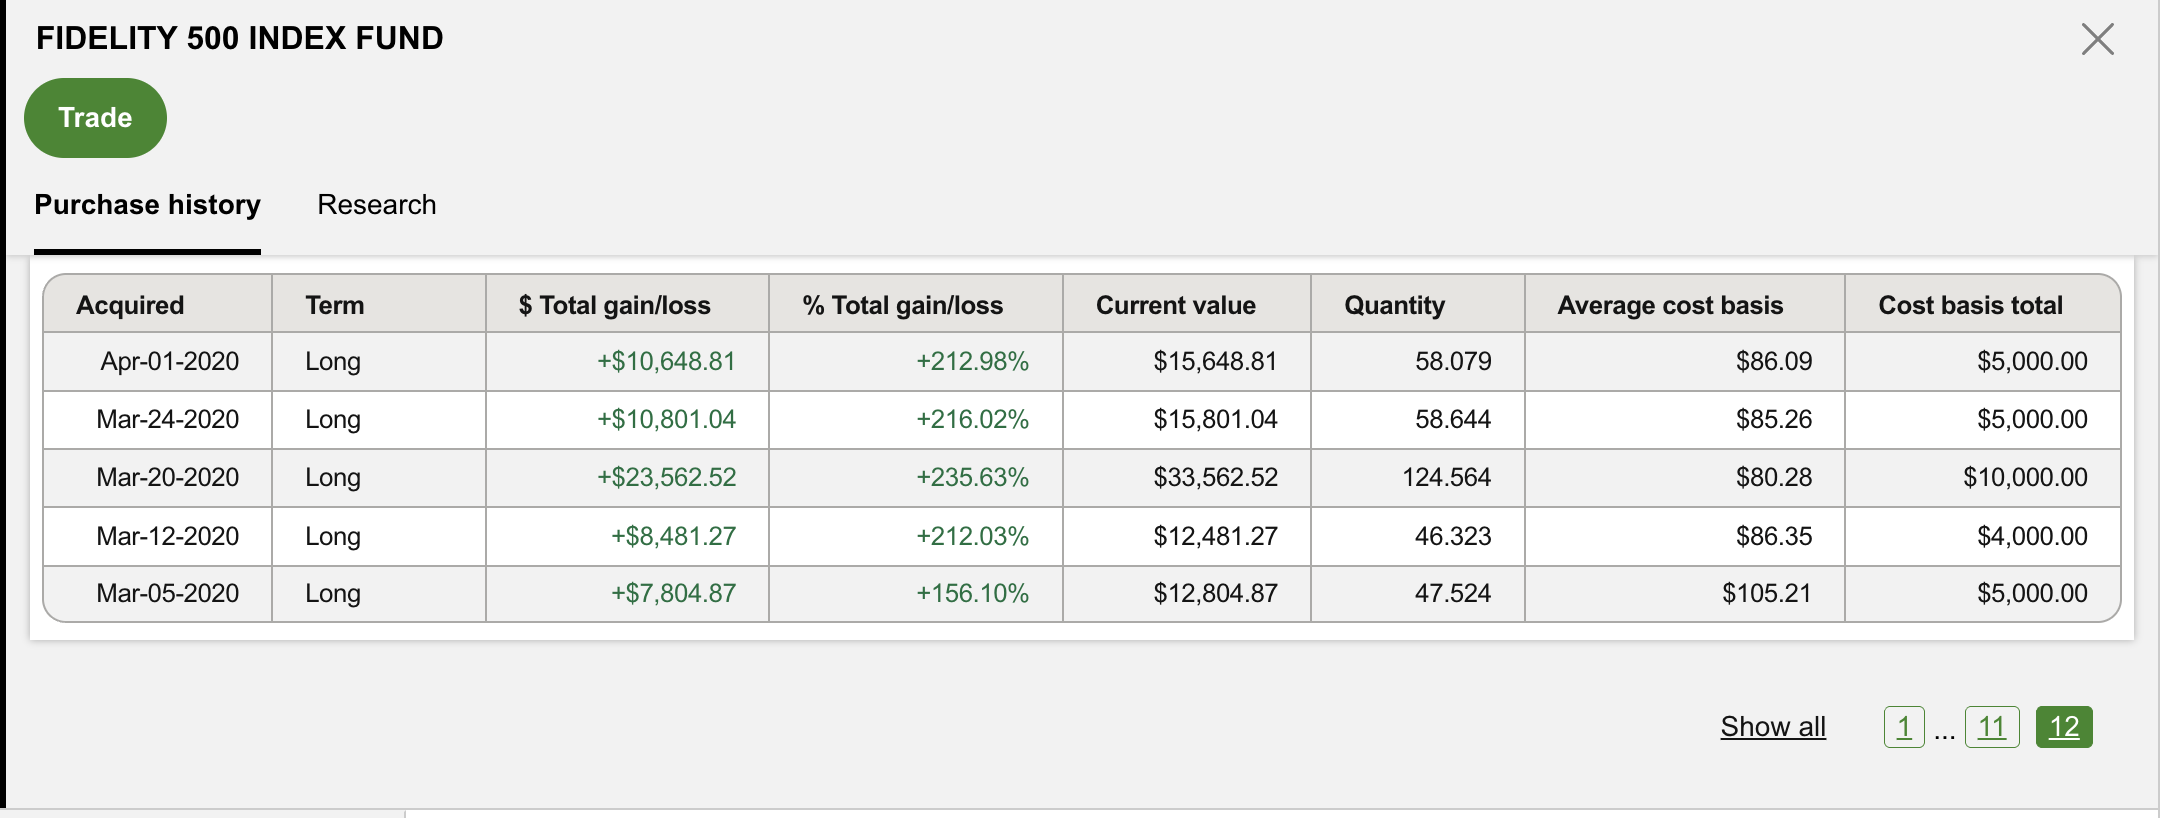
Six years of $5,000 monthly buys into the Fidelity 500 Index Fund (NASDAQ:FXAIX) puts $360,000 of principal to work in America’s largest S&P 500 mutual fund. While my initial investment shows 156% returns through today, that lags by one day since mutual funds price at market close. So, Tt harmonize data in this comparison, i’m using Yahoo Finance and CapitalIQ’s to more easily compare returns for different investments.
Based on that data, Fideilty’s FXAIX has returned 149.67% on a total-return basis, while Vanguard’s ETF twin, Vanguard S&P 500 ETF (NYSEARCA:VOO), returned 150.03% over the same window. The gap is vanishingly small, but it points at the real story that compounds: the true cost of owning a mutual fund in a taxable account extends well beyond the sticker fee. There are other factors at play, and not all S&P 500 vehicles are created equal.
What You Actually Own With FXAIX
FXAIX is a passively managed mutual fund tracking the S&P 500. It closed at $269.44 on August 12, 2026 and sits on roughly $832 billion in net assets as of the fund’s May 31, 2026 filing, making it one of the largest index funds in the world. The gross expense ratio is 0.015% as of April 29, 2026, which on a $100,000 balance works out to $15 a year. That is genuinely cheap. It is also cheaper than VOO’s 0.03%, a fact that surprises investors who assume the ETF must be the low-cost option.
Where Fidelity’s Fee Edge Quietly Erodes
The problem sits inside the fund’s plumbing. As a mutual fund, FXAIX pays out distributions quarterly, and the December payment consistently runs highest because that is when net capital gains get pushed to shareholders. The most recent four distributions ran $0.654, $0.672, $0.725, and $0.668, with the December 19, 2025 distribution of $0.725 the largest of the year. The trailing 12-month payout of $2.065 per share represents an income yield near 0.77% at today’s price.
In a Roth IRA or 401(k), that quarterly cadence is irrelevant. In a taxable brokerage, it is a bill. Every distribution is taxable in the year it hits, whether it is reinvested or not. Qualified dividends are taxed at long-term capital gains rates, but any short-term capital gains portion of the year-end distribution is taxed as ordinary income. For a saver in the 24% federal bracket, that is real money peeling off the top of a compounding balance year after year.
Where the ETF Structure Wins
VOO solves the mutual fund cap-gains-distribution problem through the ETF in-kind creation and redemption mechanism, which lets the fund flush low-basis shares to authorized participants without triggering a taxable event for holders. The result: VOO has historically avoided the year-end capital gains distributions that mutual funds pass through. Its quarterly payouts are pure dividends, most recently $1.9622 on June 26, 2026, with a trailing 12-month total of $7.3456. Same index, same underlying stocks, cleaner tax treatment.
Over the exact six-year window from August 13, 2020 to August 12, 2026, VOO’s 150.03% gain against FXAIX’s 149.67% looks like noise. Layer taxable distributions on top for six years, though, and the ETF’s structural advantage compounds into a measurable drag on the mutual fund holder living outside a retirement wrapper.
The Real Tradeoffs
FXAIX still has real advantages. Its 0.015% expense ratio undercuts VOO by half. It settles at NAV, has no bid-ask spread, allows automatic dollar-based monthly purchases (which is why the six-year autopilot habit works at all), and inside a Fidelity 401(k) or IRA, the tax drag argument disappears entirely. The concentration risk is identical to VOO’s: both funds ride the same top-heavy S&P 500 exposure, with the largest US companies commanding the biggest weights.
Who FXAIX Fits, and Who Should Look Elsewhere
Investors dollar-cost-averaging inside a 401(k), IRA, or HSA get the cheapest S&P 500 exposure available and no meaningful tax friction. Investors doing the same thing in a taxable brokerage account are quietly paying the mutual fund tax. For that group, the ETF twin is the better structure even at double the expense ratio.
Related Funds Worth Researching Next
- Vanguard S&P 500 ETF (VOO): the ETF equivalent, with better tax efficiency for taxable accounts.
- iShares Core S&P 500 ETF (NYSEARCA:IVV): BlackRock’s competing S&P 500 ETF with the same 0.03% expense ratio and ETF tax structure.
- Fidelity ZERO Large Cap Index Fund (NASDAQ:FNILX): Fidelity’s 0% expense ratio large-cap fund, though it tracks a proprietary index and is Fidelity-only.
- Vanguard Total Stock Market ETF (NYSEARCA:VTI): the broader, mid- and small-cap-inclusive alternative for investors who want more than just the S&P 500’s largest names.
Contact [email protected] for any questions or corrections.
Austin Smith is a financial publisher with over two decades of experience as an investor, analyst, and advisor. He covers stocks, ETFs, Artificial intelligence and personal finance for 24/7 Wall St. Previously, he spent over a decade at The Motley Fool as a senior editor for Fool.com, portfolio advisor for Millionacres, and launched The Ascent to help reader take control of their personal finances.
His work has been featured on Fool.com, NPR, CNBC, USA Today, Yahoo Finance, MSN, AOL, Marketwatch, and many other publications. He is as an advisor to private companies, and co-hosts The AI Investor Podcast with Eric Bleeker.
When not looking for investment opportunities, he can be found skiing, running, or playing soccer with his children. Learn more about Austin's investment approach here.