Walmart’s E-Commerce Engine Roars, Here’s Where It’ll End The Year
Walmart's digital business is quietly reshaping the company's earnings mix in a way most investors haven't priced in yet, and the back half of the year may be where the market finally notices.

Walmart (NYSE:WMT | WMT Price Prediction) has quietly become one of the most interesting large-cap growth stories in retail, with a digital flywheel that increasingly resembles a diversified commerce platform rather than a traditional big-box operator. After a pullback from winter highs, the risk/reward has tilted back in shareholders’ favor heading into the back half of the year.
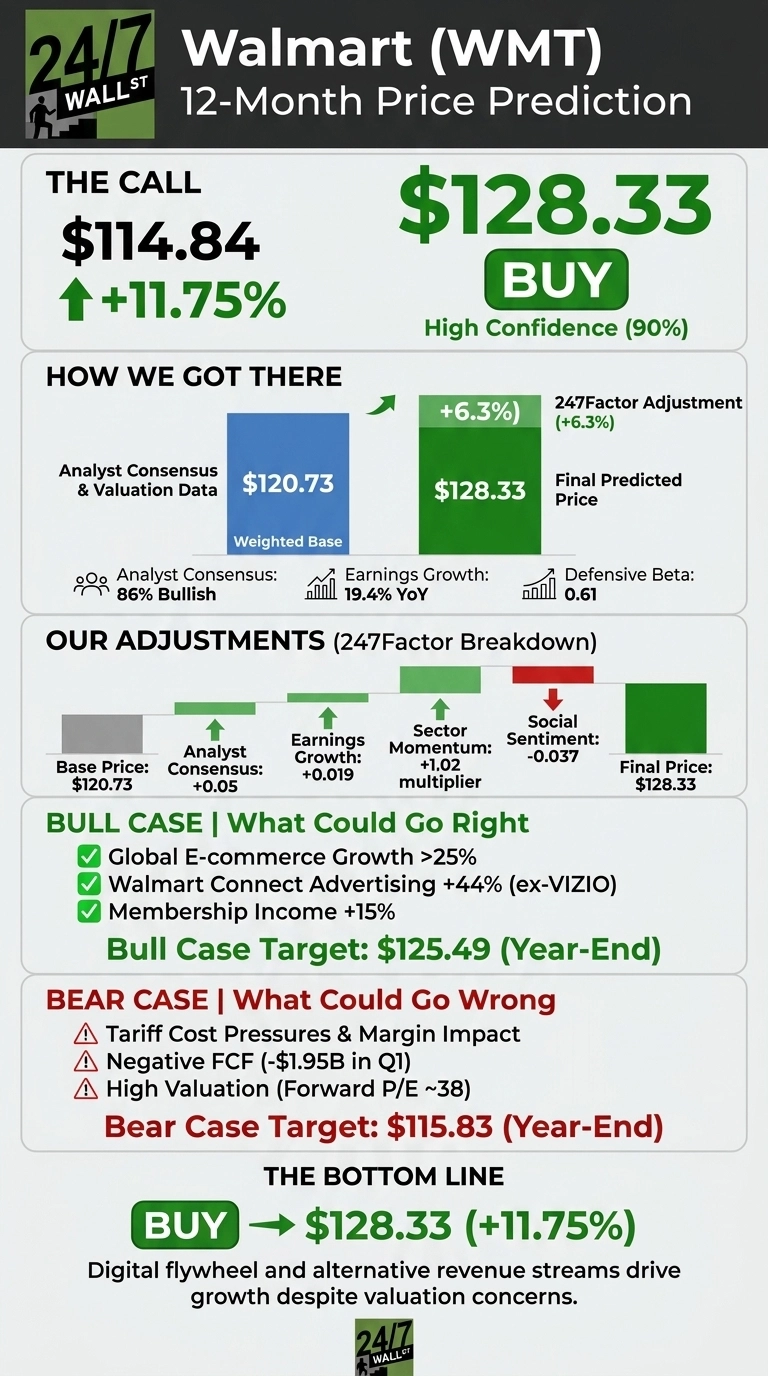
Our 24/7 Wall St. price target for Walmart is $128.33, implying 11.75% upside from the current price of $114.84. Our recommendation is buy at a 90% confidence level.
24/7 Wall St. Price Target Summary
| Metric | Value |
|---|---|
| Current Price | $114.84 |
| 24/7 Wall St. Price Target | $128.33 |
| Upside | 11.75% |
| Recommendation | BUY |
| Confidence Level | 90% |
The Digital Flywheel Is Doing the Heavy Lifting
Walmart shares are up 2.07% year to date and 9.89% over the past year, trading roughly 2% below the 52-week high of $135.16 and well off the $94.85 low.
The Q1 FY27 report delivered $175.68 billion in revenue, up 6.1%, with adjusted EPS of $0.66. The standout: global e-commerce sales grew 26% and now represent 23% of net sales, while Walmart Connect advertising rose 44% ex-VIZIO and marketplace sales jumped 50%, the best result in ten quarters.
On the Q2 call, CFO John David Rainey put it plainly: “50% of our incremental profit, excluding claims, was related to advertising, membership, and marketplace.” That is the whole thesis in one sentence.
Why Bulls See a Breakout Ahead
The bull case rests on the “two P&L” framework CEO Doug McMillon has highlighted: the traditional store business plus a higher-margin digital layer built on marketplace, advertising, and membership.
TD Cowen carries a $150 price target, arguing the multiple reset offers a favorable entry point. Mizuho sits at $130. The Street consensus is $137.97. If holiday execution matches management’s confidence and Walmart Connect compounds at 40%+, our bull case scenario points to $125.49 by year-end.
What Could Go Wrong
Walmart trades at a forward P/E of 38, expensive by historical measure for a business with a 3.07% net margin. Tariff pass-through is hitting inventory costs weekly, and Walmart is absorbing meaningfully. Q1 FCF was negative $1.95 billion on $6.68 billion of capex.
Insider activity is currently net selling. Counterfactual: much of that capex funds automation and fulfillment capacity underpinning the same e-commerce growth bulls are paying for. Under a bear scenario, our model projects $115.83 by December.
How Walmart Compares to Costco and Kroger
Costco (NASDAQ:COST) is the obvious membership-model peer. Costco carries a richer forward P/E of 42 and posted 45.5% quarterly earnings growth against 21.5% revenue growth. That premium makes Walmart’s 38 forward multiple look reasonable, particularly given Walmart’s advertising and marketplace optionality Costco lacks.
Kroger (NYSE:KR) is the domestic grocery counterpoint. Kroger’s e-commerce grew 19% last quarter was healthy but visibly slower than Walmart’s 26%. Kroger trades at a mid-teens forward multiple, framing Walmart as the growth-premium name in defensive retail, which supports our target.
| Company | Forward P/E | Recent Rev Growth |
|---|---|---|
| Walmart | 38 | 6.1% |
| Costco | 42 | 21.5% |
| Kroger | ~15 | ~5% |
I’d Buy It Here
The 24/7 Wall St. price target of $128.33 reflects a business whose earnings mix is quietly improving even as the top line grows mid-single digits.
I would be a buyer if Q2 confirms e-commerce growth holding above 25% and advertising above 40%. I would step aside if tariff pass-through starts compressing US operating margins in the back half. On balance, this is a buy.
| Year | 24/7 Wall St. Price Target |
|---|---|
| 2026 | $117.88 |
| 2027 | $128.33 |
| 2028 | $141.21 |
| 2029 | $149.49 |
| 2030 | $161.63 |
These projections assume Walmart continues executing on digital, advertising, and membership. Significant upside or downside could come from tariff resolution and the pace at which Sparky and agentic commerce scale.
Contact [email protected] for any questions or corrections.
Vandita Jadeja is a financial publisher with over a decade of experience writing about financial topics, including investment, savings, retirement, insurance and banking. Vandita is a Chartered Accountant who loves to debunk financial concepts for readers.
Her work has appeared on sites that include The Motley Fool, InvestorPlace, and Benzinga. She covers investing and focuses on stock picks and price prediction for 24/7 Wall St.
When not looking for the next stock investment opportunity, she can be found traveling, reading, chasing sunsets and enjoying her iced latte.