Costco Has a Secret Growth Engine. Wall Street May Be Underestimating It.
Costco's membership business is compounding at a rate Wall Street continues to treat as a sideshow, and that gap between perception and reality is exactly where the opportunity lives.


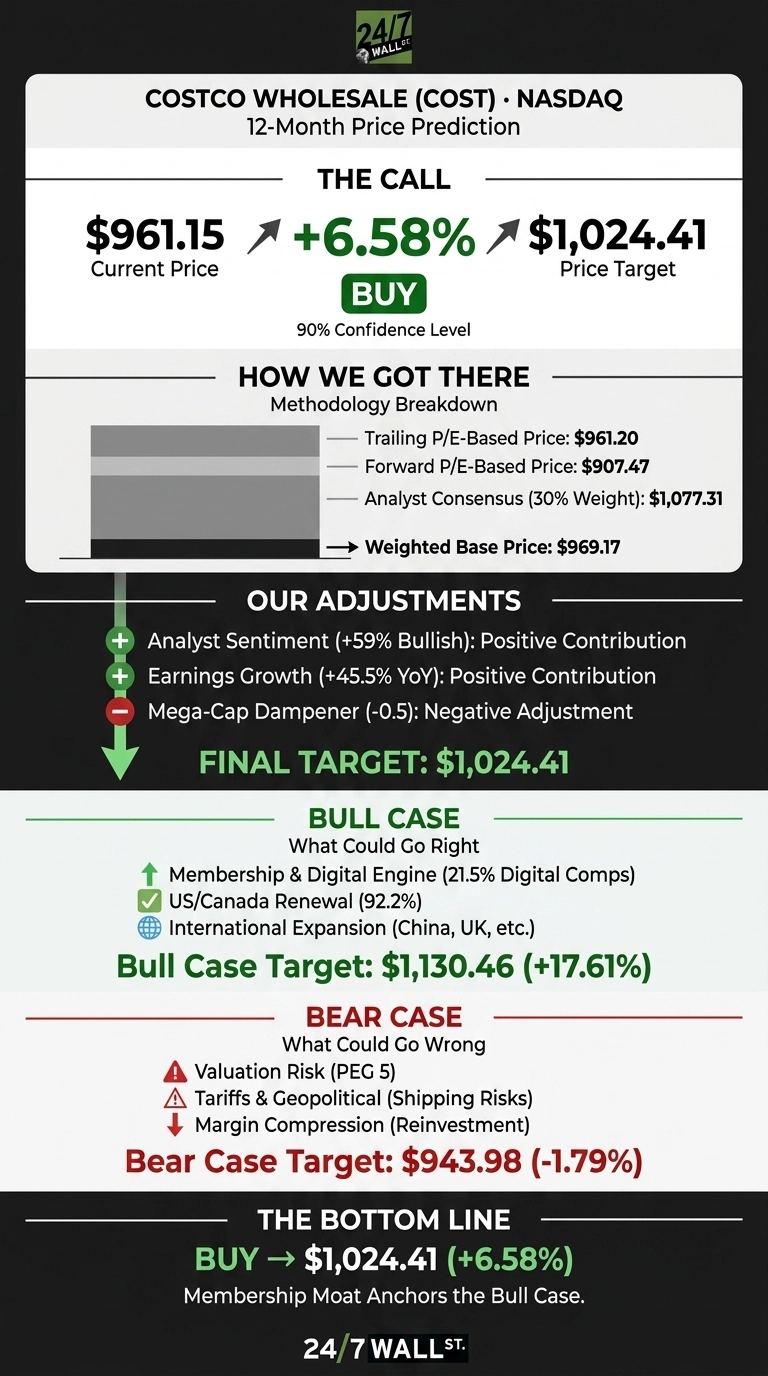
Costco (NASDAQ: COST | COST Price Prediction) trades at $961.15, and our proprietary model sees moderate room to run. The 24/7 Wall St. price target for Costco is $1,024.41 over the next 12 months, implying 6.58% upside.
Our recommendation is buy, with a 90% confidence level. What drives the call is a membership and digital engine Wall Street still treats as secondary.
24/7 Wall St. Price Target Summary
| Metric | Value |
|---|---|
| Current Price | $961.15 |
| 24/7 Wall St. Price Target | $1,024.41 |
| Upside | 6.58% |
| Recommendation | BUY |
| Confidence Level | 90% |

Membership Fees Drive Growth
Costco is up 1.88% over the past week, 3.89% on the month, and 13.14% year to date.
The May Q3 report delivered EPS of $4.93 on revenue of $70.53 billion, up 11.58% year over year, with net income climbing 15.19%. Membership fee income hit $1.373 billion, up 10.7%, paid Executive memberships reached 41.2 million, and digitally enabled comparable sales jumped 21.5% as site traffic surged 37%.
Why Bulls See a Breakout
The bull case rests on a compounding engine. US and Canada renewal is 92.2%, worldwide renewal is 89.7%, and Executive members now drive 75% of sales. Management sees 30 plus net new warehouses annually, with China, Korea, Japan, and the UK identified as long runways.
Digitally enabled comps of 21.5%, AI-driven traffic growing at triple-digit rate, and a new Google Commerce Media and YouTube retail media partnership layer high-margin income on warehouse economics. Our bull-case scenario values the stock at $1,130.46, a 17.61% total return. The average sell-side target sits at $1,077.31 with 23 positive ratings versus 2 negative.

What Could Go Wrong
Valuation is the key risk. Costco trades at 48x trailing earnings and 42x forward, with a PEG of 5. Any deceleration in comps or membership growth could trigger multiple compression. Management flagged tariff impacts, resin inflation, memory-chip costs, and Middle East shipping risk.
Core-on-core margins slipped nine basis points as Costco reinvested in lower prices, a deliberate move designed to widen Costco’s value gap. Our bear-case path lands at $943.98, a modest 1.79% pullback.

How Costco Compares to Walmart and BJ’s Wholesale
Walmart (NYSE: WMT) is the most relevant scale comp. Walmart’s FY27 Q2 delivered adjusted EPS of $0.81 on revenue of $187.94 billion, and the stock trades at a trailing P/E near 39. Costco commands a materially higher multiple because renewal rates, Executive penetration, and digital comps outpace Sam’s Club.
BJ’s Wholesale Club (NYSE: BJ) is the pure warehouse-club comp. It posted Q2 FY27 EPS of $1.36, a 16.52% beat, with membership fee income up 9.9% and FY26 EPS guidance of $4.60 to $4.80. BJ’s is executing, but its $12.19 billion market cap and smaller international runway make Costco’s premium defensible.
Membership Moat Anchors the Bull Case
The 24/7 Wall St. model rates Costco a buy with a price target of $1,024.41 at 90% confidence. The tipping factor is membership. High-margin recurring income compounding at double-digit rates, combined with a 92.2% renewal rate in the core market, is the closest thing retail offers to a subscription business.
The 200-day moving average sits at $959.29, a technical reference point for accumulation setups. Key signals to monitor include comparable traffic slipping below 2% or Executive penetration stalling.
Costco Price Prediction 2026 to 2030
| Year | 24/7 Wall St. Price Target |
|---|---|
| 2026 | $987.92 |
| 2027 | $1,051.48 |
| 2028 | $1,112.91 |
| 2029 | $1,155.35 |
| 2030 | $1,237.97 |
These projections assume Costco continues executing on membership growth, international warehouse expansion, and digital acceleration. Significant upside or downside could result from tariff regime shifts, a China ramp faster than modeled, or compression in consumer-defensive multiples.
Contact [email protected] for any questions or corrections.
Vandita Jadeja is a financial publisher with over a decade of experience writing about financial topics, including investment, savings, retirement, insurance and banking. Vandita is a Chartered Accountant who loves to debunk financial concepts for readers.
Her work has appeared on sites that include The Motley Fool, InvestorPlace, and Benzinga. She covers investing and focuses on stock picks and price prediction for 24/7 Wall St.
When not looking for the next stock investment opportunity, she can be found traveling, reading, chasing sunsets and enjoying her iced latte.