Fidelity Sells Two Funds With the Same Name and the Same Target Year. One Costs 5x More
Fidelity offers two funds aimed at the same retirement year under nearly identical names, and most investors holding the pricier one have no idea the other exists inside their own account.

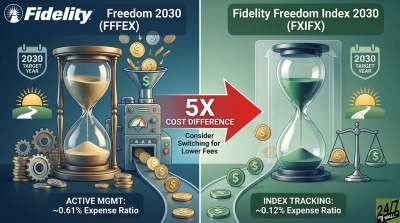
If you own the Fidelity Freedom 2030 Fund (NASDAQ:FFFEX) inside your 401(k) or IRA, you almost certainly picked it for one reason: you plan to retire around 2030, and Fidelity handles the stock/bond mix and the glide path for you. FFFEX is a set-and-forget vehicle, actively managed by Fidelity portfolio managers who tactically shift among underlying Fidelity funds as you age. Nothing about that thesis is wrong. But Fidelity sells a second fund with a nearly identical name and the same 2030 target year, and it charges roughly one-fifth the expense ratio. FFFEX holders should at least know it exists before another year of contributions goes in.
What FFFEX Actually Does
FFFEX is a fund-of-funds. It owns actively managed Fidelity stock and bond funds and rebalances toward more bonds as 2030 approaches. Investors have entrusted it with roughly $33.1 billion in net assets as of March 31, 2026, which tells you plenty of people are comfortable paying Fidelity to make active calls on their behalf. The appeal is understandable: one ticker, one decision, and professional oversight.
Fee Gap Inside the Same Brand
According to its most recent prospectus (dated May 29, 2026), FFFEX charges a net expense ratio of 0.61%. The sibling fund, Fidelity Freedom Index 2030 Fund (NASDAQ:FXIFX), is also a fund-of-funds targeting 2030, but its underlying holdings are Fidelity index funds rather than active ones. Its prospectus dated the same day, May 29, 2026, lists a net expense ratio of 0.12%.
That is a 0.49 percentage point gap, or roughly 5x more in annual fees for the active version. On a $100,000 balance, that difference works out to about $490 per year paid to Fidelity for active management inside FFFEX that you would not pay inside FXIFX. Compound that across five to seven working years until 2030 and then a two- to three-decade retirement drawdown, and the fee drag becomes meaningful money.
Has the Active Version Earned Its Fee?
On an adjusted-price basis, FFFEX has actually delivered slightly better returns than FXIFX over most trailing windows: FFFEX is up 138.65% over ten years, 39.02% over five years, and 16.8% over one year through August 21, 2026, versus 129.77%, 35.46%, and 14.53% for FXIFX over the same windows. So the higher fee has not obviously destroyed value historically.
The catch is that Fidelity’s active and index Freedom lineups have historically run somewhat different glide paths and asset mixes, so part of that return gap reflects allocation differences, not manager skill. While fees are a certainty, future active outperformance is not. Paying 5x more for a bet that active managers keep winning by a small margin can be a costly bet — especially if it doesn’t play out.
Why the Switch Is Usually Painless
Target-date funds live almost exclusively inside tax-advantaged accounts. If FFFEX sits in your 401(k), 403(b), Traditional IRA, or Roth IRA, swapping to FXIFX triggers zero capital-gains tax, because trades inside those accounts are not taxable events. That removes the single biggest friction that normally kills fund-swap ideas. If your employer plan offers both, the swap is a menu change. If it only offers FFFEX, this becomes a question for whoever runs plan investments, and the fee data gives you a specific case to make.
One caveat: if you hold FFFEX in a taxable brokerage account, which is unusual for target-date funds, check embedded gains before selling. There, the tax bill can outweigh several years of fee savings.
What This Means for Your 2030 Bucket
FFFEX is a fully competent target-date product with $33.1 billion of investor trust behind it. But inside the same Fidelity Freedom brand, aimed at the same retirement year, an index-based version exists at 0.12% versus 0.61%. If you already own FFFEX in a retirement account and your plan offers FXIFX, moving new contributions, or the whole position, into FXIFX locks in a known 0.49 percentage-point annual savings in exchange for giving up an active-management premium that may or may not repeat. That is a tradeoff worth evaluating against your own timeline, not a call to make on a headline.
Contact [email protected] for any questions or corrections.
Ryne Mauck is an investment writer covering exchange-traded funds, retirement planning, and portfolio strategy. Through his work at 24/7 Wall St. and other investment platforms, including Seeking Alpha, he aims to provide clear, research-driven insights that help investors make more informed decisions while maintaining a long-term approach to investing.
Ryne holds a B.Sc. in Finance and an M.A. in Political Science. He is a formerly registered Municipal Advisor Representative and has passed the Series 50, Series 63, and Series 65 exams. His articles are not intended to be, nor should they be interpreted as, financial advice.