Obama Added $1.17 Trillion Per Year To The National Debt Over 8 Years. Only 2 Presidents Have Added More.
Raw totals tell one story about Obama's debt legacy, but ranking presidents by annual pace reshapes the list in ways most people never see. Three terms sit above him, and two belong to the same president.


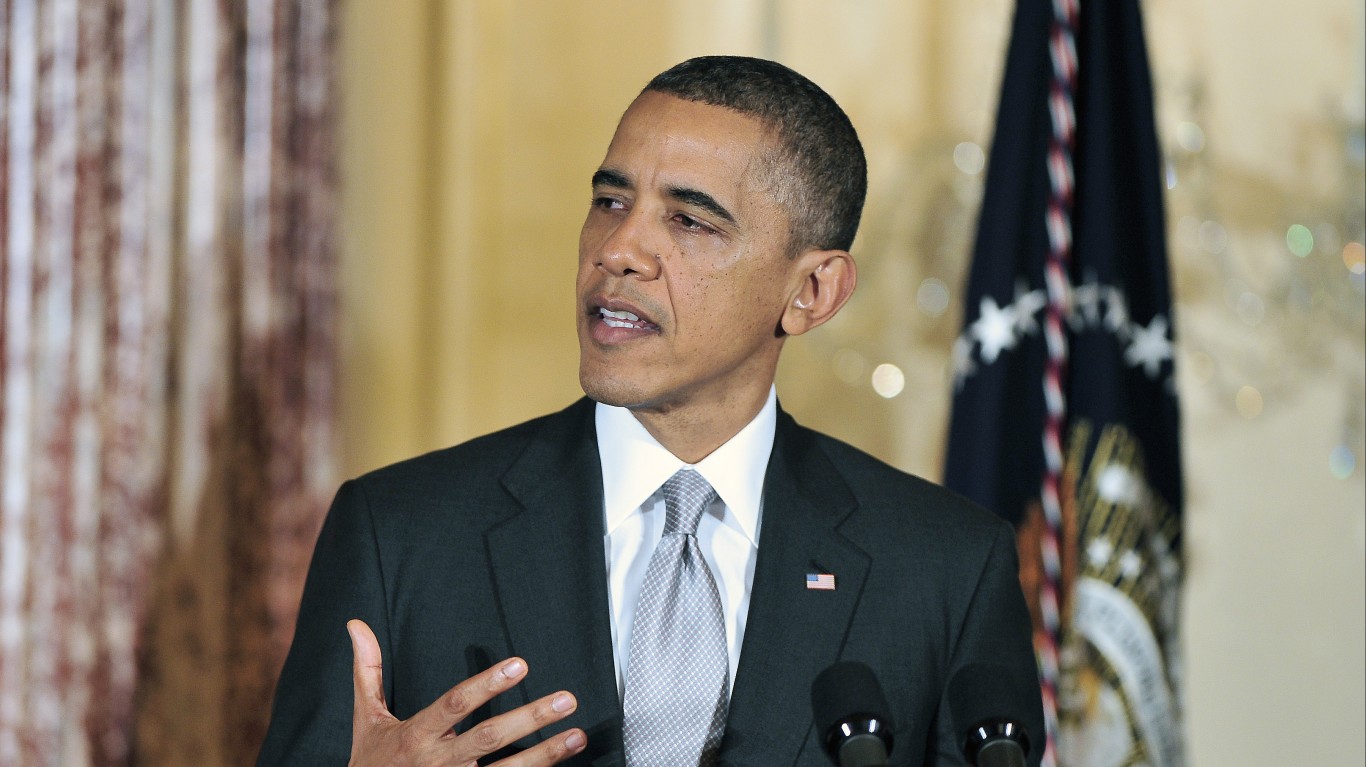
Wall Street remembers Barack Obama as the president who inherited a financial crisis and left office with the debt roughly doubled. Obama added roughly $9.32 trillion to Total Public Debt Outstanding across his two terms, the largest raw total of any completed presidency. On a per-year basis, however, he ranks fourth. He served eight years, and the per-year figure comes to roughly $1.17 trillion per year, behind three modern terms that ran hotter on a shorter clock.
Our Aug. 25 piece led on Joe Biden and ranked presidents by total debt added; our Aug. 17 piece covered the same total-dollar ranking. Ranking by average annual pace changes the list, and Obama illustrates why.
A Quick Note On Trump’s Two Terms
The table below ranks by term. Three terms sit above Obama on a per-year basis: Donald Trump’s second term, Joe Biden’s term, and Donald Trump’s first term. Those three terms belong to two distinct presidents, because Trump appears twice.
Methodology Notes
- Nominal dollars, not inflation-adjusted. A dollar added in 1981 is not equivalent to a dollar added in 2024. Unadjusted figures mechanically favor recent presidents because both the economy and the debt are far larger now.
- Inauguration-day snapshots. Figures use Total Public Debt Outstanding on inauguration day, per Congressional Research Service tracking. Fiscal-year-end (Sept. 30) snapshots yield slightly different numbers.
- First-year figures are partly inherited. Budgets and appropriations run on a lag. Early months of any term operate under levels set by the prior administration and Congress.
- Congress controls appropriations and revenue law. These figures describe what happened during each presidency, not sole responsibility.
- Unusual term boundaries. Presidents such as Nixon and Ford have years-in-office numbers that are standard term-boundary approximations.
Ranking By Average Annual Debt Added
| Rank | President | Term | Debt at Start | Debt at End | Total Added | Years | Avg. Added Per Year |
|---|---|---|---|---|---|---|---|
| 1* | Donald Trump (2nd term) | 2025 to present (in progress) | $36.2T (Jan 21, 2025) | ~$39.9 to 40T (mid/late Aug. 2026) | ~$3.7 to 3.8T | ~1.58 (partial) | ~$2.3 to 2.4T/year (annualized pace, not final) |
| 2 | Joe Biden | 2021 to 2025 | $27.75T (Jan 20, 2021) | ~$36.2T (Jan 21, 2025) | ~$8.45T | 4 | ~$2.11T/year |
| 3 | Donald Trump (1st term) | 2017 to 2021 | $19.95T (Jan 20, 2017) | $27.75T (Jan 20, 2021) | ~$7.80T | 4 | ~$1.95T/year |
| 4 | Barack Obama | 2009 to 2017 | $10.63T (Jan 20, 2009) | $19.95T (Jan 20, 2017) | ~$9.32T | 8 | ~$1.17T/year |
| 5 | George W. Bush | 2001 to 2009 | $5.73T (Jan 19, 2001) | $10.63T (Jan 20, 2009) | ~$4.90T | 8 | ~$612B/year |
| 6 | George H.W. Bush | 1989 to 1993 | $2.70T (Jan 31, 1989) | $4.17T (Jan 31, 1993) | ~$1.47T | 4 | ~$367B/year |
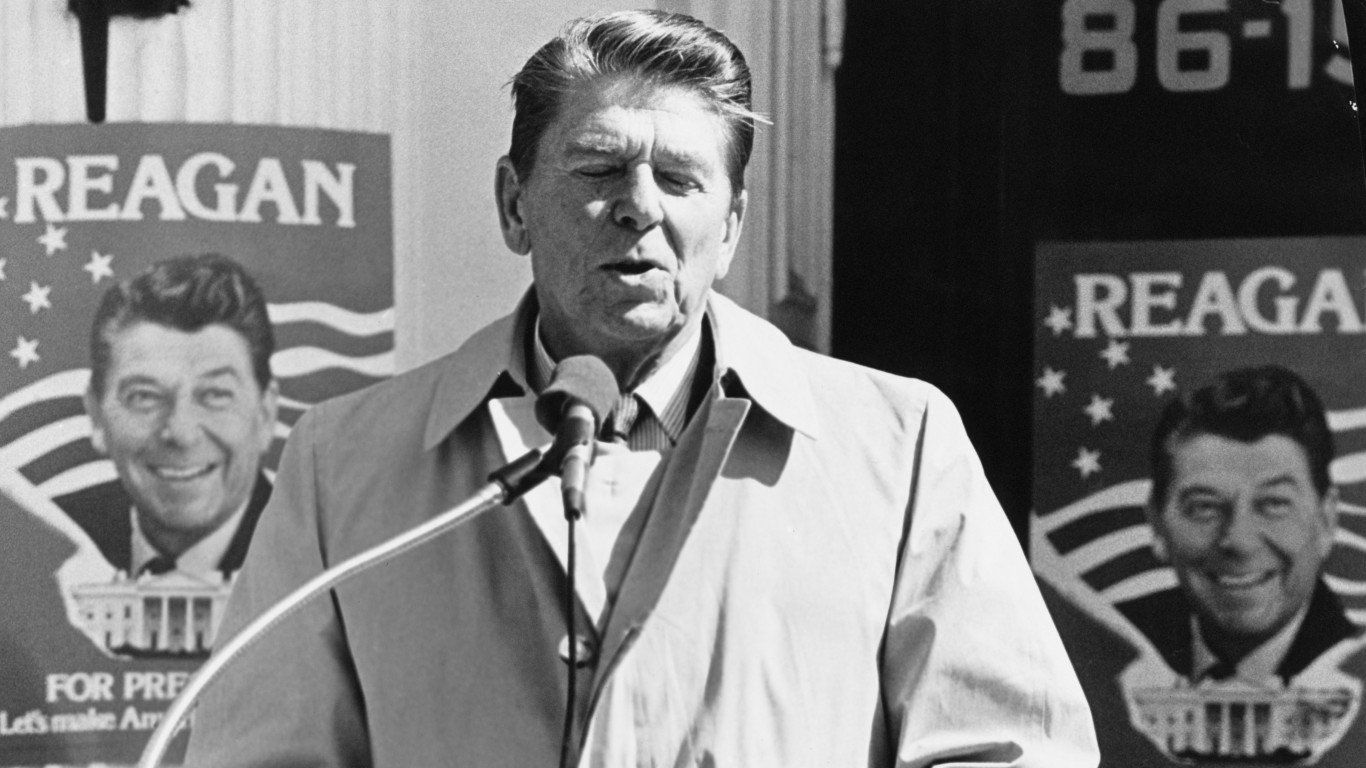
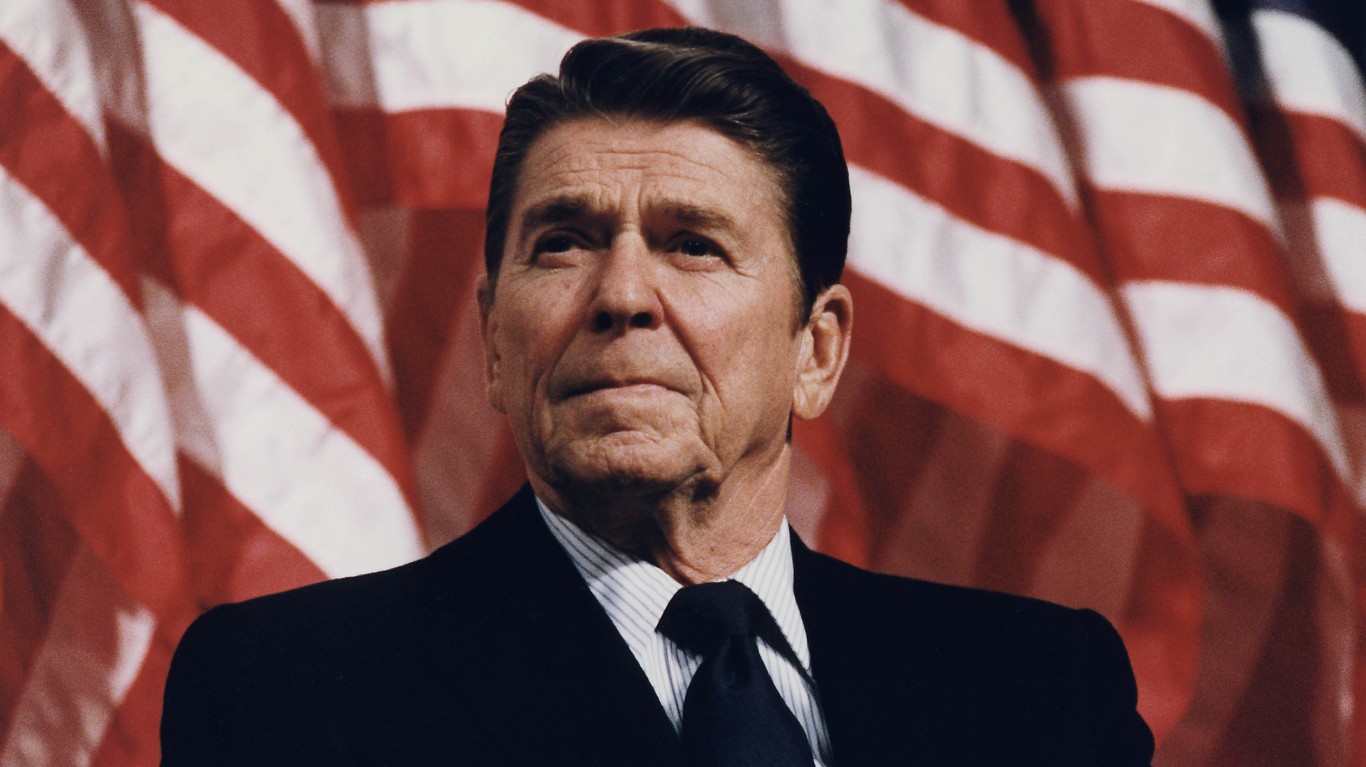
| 7 | Ronald Reagan | 1981 to 1989 | $934B (Jan 31, 1981) | $2.70T (Jan 31, 1989) | ~$1.76T | 8 | ~$221B/year |
| 8 | Bill Clinton | 1993 to 2001 | $4.17T (Jan 31, 1993) | $5.73T (Jan 19, 2001) | ~$1.56T | 8 | ~$195B/year |
| 9 | Jimmy Carter | 1977 to 1981 | $698.8B | $997.9B | ~$299B | 4 | ~$75B/year |
| 10 | Gerald Ford | 1974 to 1977 | $475.1B | $698.8B | ~$224B | ~2.5 to 3 | ~$75B/year |
| 11 | Richard Nixon | 1969 to 1974 | $353.7B | $475.1B | ~$121B | ~5 | ~$24B/year |
*Row 1 is an incomplete term. The per-year cell is an annualized pace derived from roughly 19 months of data, not a final figure. The Jan. 21, 2025 starting figure of $36.2T comes from secondary reporting rather than the Congressional Research Service series, which predates it.
Row 1 Caveat: Term Still In Progress
Trump’s second term is not complete. A single large spending bill, a debt-ceiling deal, or a slowdown in outlays could move the pace materially before Jan. 20, 2029. Biden’s term remains the highest confirmed full-term figure on record. The White House has attributed the second-term increase to higher spending on entitlement programs and debt interest, tax cuts, and tariff-refund payments.
Crossing The $40 Trillion Milestone
The debt crossed $40 trillion for the first time around Aug. 19, 2026, reported by the AP, WSJ, CNN, Fox Business, Yahoo Finance, Reuters, and CBS News. Mercury News framed the milestone as raising “doom loop” risk. Bloomberg Businessweek tied the record to rising 30-year Treasury yields, up roughly 40 basis points year to date, and to the crowding-out debate around Treasury issuance competing with private-sector capital raises. FRED’s quarterly Federal Debt: Total Public Debt series shows $39.07 trillion at the Jan. 1, 2026 reading, consistent with the mid-August crossing. Combined across both Trump terms, the total sits at roughly $11.5 to 11.6 trillion, or about a quarter of the current debt.
Why FDR Doesn’t Crack The Top 10
Franklin D. Roosevelt illustrates why nominal-dollar rankings matter. Across 1933 to 1945, spanning the Great Depression and World War II, the debt grew from about $22.5 billion to about $258.7 billion, over 1,000% in percentage terms but roughly $19.7 billion per year in nominal dollars. That falls short of the modern top 10 because the entire federal budget was a fraction of its current size. The ranking reflects unadjusted dollars rather than relative fiscal impact.
What To Watch Next
The FRED FYFSD series shows a federal deficit of $1,774,684 million for the fiscal year ending Sept. 30, 2025. Treasury’s Daily Statement shows a TGA closing balance of $950.8 billion on Aug. 27, 2026, a cash cushion that shapes near-term issuance decisions. The per-year ranking will shift when the current term closes and the annualized pace becomes a final figure.
Contact [email protected] for any questions or corrections.
AJ spent 10 years writing about financial markets at The Motley Fool. His coverage centers on technology stocks and the broader macroeconomic trends, from interest rates to geopolitics, that shape where markets are headed next. AJ is drawn to the stories where big-picture economics and individual companies collide.