The National Debt Rose About $1.17 Trillion a Year During Obama’s Presidency. Here’s How Other Modern Terms Compare
Every modern president has added to the national debt, but the pace has shifted dramatically from one administration to the next, and the raw dollar figures hide surprises that cut against the conventional wisdom about which eras were the most…


Barack Obama took office with total federal debt at about $10.63 trillion and left eight years later with it just under $19.95 trillion. That works out to an increase of roughly $9.32 trillion, or about $1.17 trillion per year on average.
That sounds enormous, and in nominal dollars it is. But comparing presidents this way comes with several important caveats. The federal government and economy have grown dramatically over time, inflation makes older dollars worth more than today’s dollars, and presidents do not control spending or tax law by themselves. Still, looking at the same Treasury debt measure at presidential transitions provides a useful snapshot of how quickly gross federal debt changed during different administrations.
First, Here Is What These Numbers Actually Measure
The figures in this slideshow use Total Public Debt Outstanding, the Treasury’s broad measure of gross federal debt. It includes debt held by investors, financial institutions, the Federal Reserve, foreign holders, and others outside the federal government, along with intragovernmental debt held by federal trust funds and other government accounts.
The comparisons use current dollars rather than inflation-adjusted dollars. Where daily Treasury data are available, the figures use inauguration-day or immediately adjacent business-day balances. For several older presidents, the Congressional Research Service uses the nearest month-end Treasury figure instead. The annual number is simply the change between the starting and ending balances divided by the approximate number of years in office. It is not the same thing as the annual federal deficit, and it should not be read as a score of one president’s fiscal responsibility. Congress, economic conditions, emergencies, inherited budgets, tax law, and mandatory programs all affect what happens to the debt.
Donald Trump, Second Term: About $2.30 Trillion Per Year So Far

Total public debt stood at roughly $36.22 trillion on Jan. 21, 2025, the first business-day Treasury snapshot after Trump’s second inauguration. By Sept. 24, 2026, it was about $40.07 trillion. That is an increase of approximately $3.85 trillion over roughly 1.67 years, producing an annualized pace of about $2.30 trillion.
This is the one figure in the comparison that should come with a flashing asterisk. The term does not end until January 2029, so this is an annualized snapshot rather than a completed four-year average. Debt can move sharply over relatively short periods because of tax collections, spending, Treasury cash management, legislation, economic conditions, and other factors. One milestone is already in the books: Treasury’s Aug. 18, 2026 balance pushed total public debt above $40 trillion for the first time.
Joe Biden: About $2.12 Trillion Per Year
Total public debt was about $27.75 trillion when Biden took office on Jan. 20, 2021. The closest Treasury snapshot after his term ended put it at about $36.22 trillion on Jan. 21, 2025. The difference is roughly $8.47 trillion over four years, or about $2.12 trillion per year.
Those four years began while the federal government was still dealing with the pandemic and its economic aftermath, but large deficits continued after the most acute phase of emergency spending ended. As with every president on this list, the debt increase combines legislation signed by the president, laws enacted by Congress, mandatory spending already embedded in federal law, interest costs, economic conditions, and policies inherited from previous years.
Donald Trump, First Term: About $1.95 Trillion Per Year

Total public debt stood at approximately $19.95 trillion when Trump began his first term on Jan. 20, 2017. Four years later, it was about $27.75 trillion. The increase of roughly $7.80 trillion works out to about $1.95 trillion per year.
The four-year average hides an extraordinary final year. The COVID-19 pandemic triggered a recession and several enormous bipartisan relief packages, producing an abrupt jump in federal borrowing during 2020. That makes the first Trump term another good example of why a simple debt-per-year calculation describes what happened during an administration without explaining all of the reasons it happened.
Barack Obama: About $1.17 Trillion Per Year
Obama entered office on Jan. 20, 2009, with total public debt at approximately $10.63 trillion. On Jan. 20, 2017, it stood at about $19.95 trillion. That is a nominal increase of roughly $9.32 trillion across eight years, averaging about $1.17 trillion per year.
Obama’s presidency began in the middle of the financial crisis and Great Recession, when falling revenue and emergency spending were already putting major pressure on the federal budget. The debt continued climbing throughout both terms, although the annual federal deficit fell substantially from the extraordinary levels recorded around the recession before widening again later. In raw nominal dollars, the $9.32 trillion increase was larger than the increase during any previous eight-year presidency.
George W. Bush: About $612 Billion Per Year

Total public debt was approximately $5.73 trillion near the beginning of George W. Bush’s presidency in January 2001. By Jan. 20, 2009, it had reached about $10.63 trillion. The increase was roughly $4.90 trillion, or about $612 billion for each of his eight years in office.
Those years included the wars in Afghanistan and Iraq, major changes to federal tax law, the creation and expansion of several federal programs, and finally the 2008 financial crisis. The timing matters here too. Bush left office while the government was responding to a severe financial emergency, so part of the debt associated with that crisis appears at the end of his term while additional effects appear during the beginning of Obama’s.
George H.W. Bush: About $367 Billion Per Year
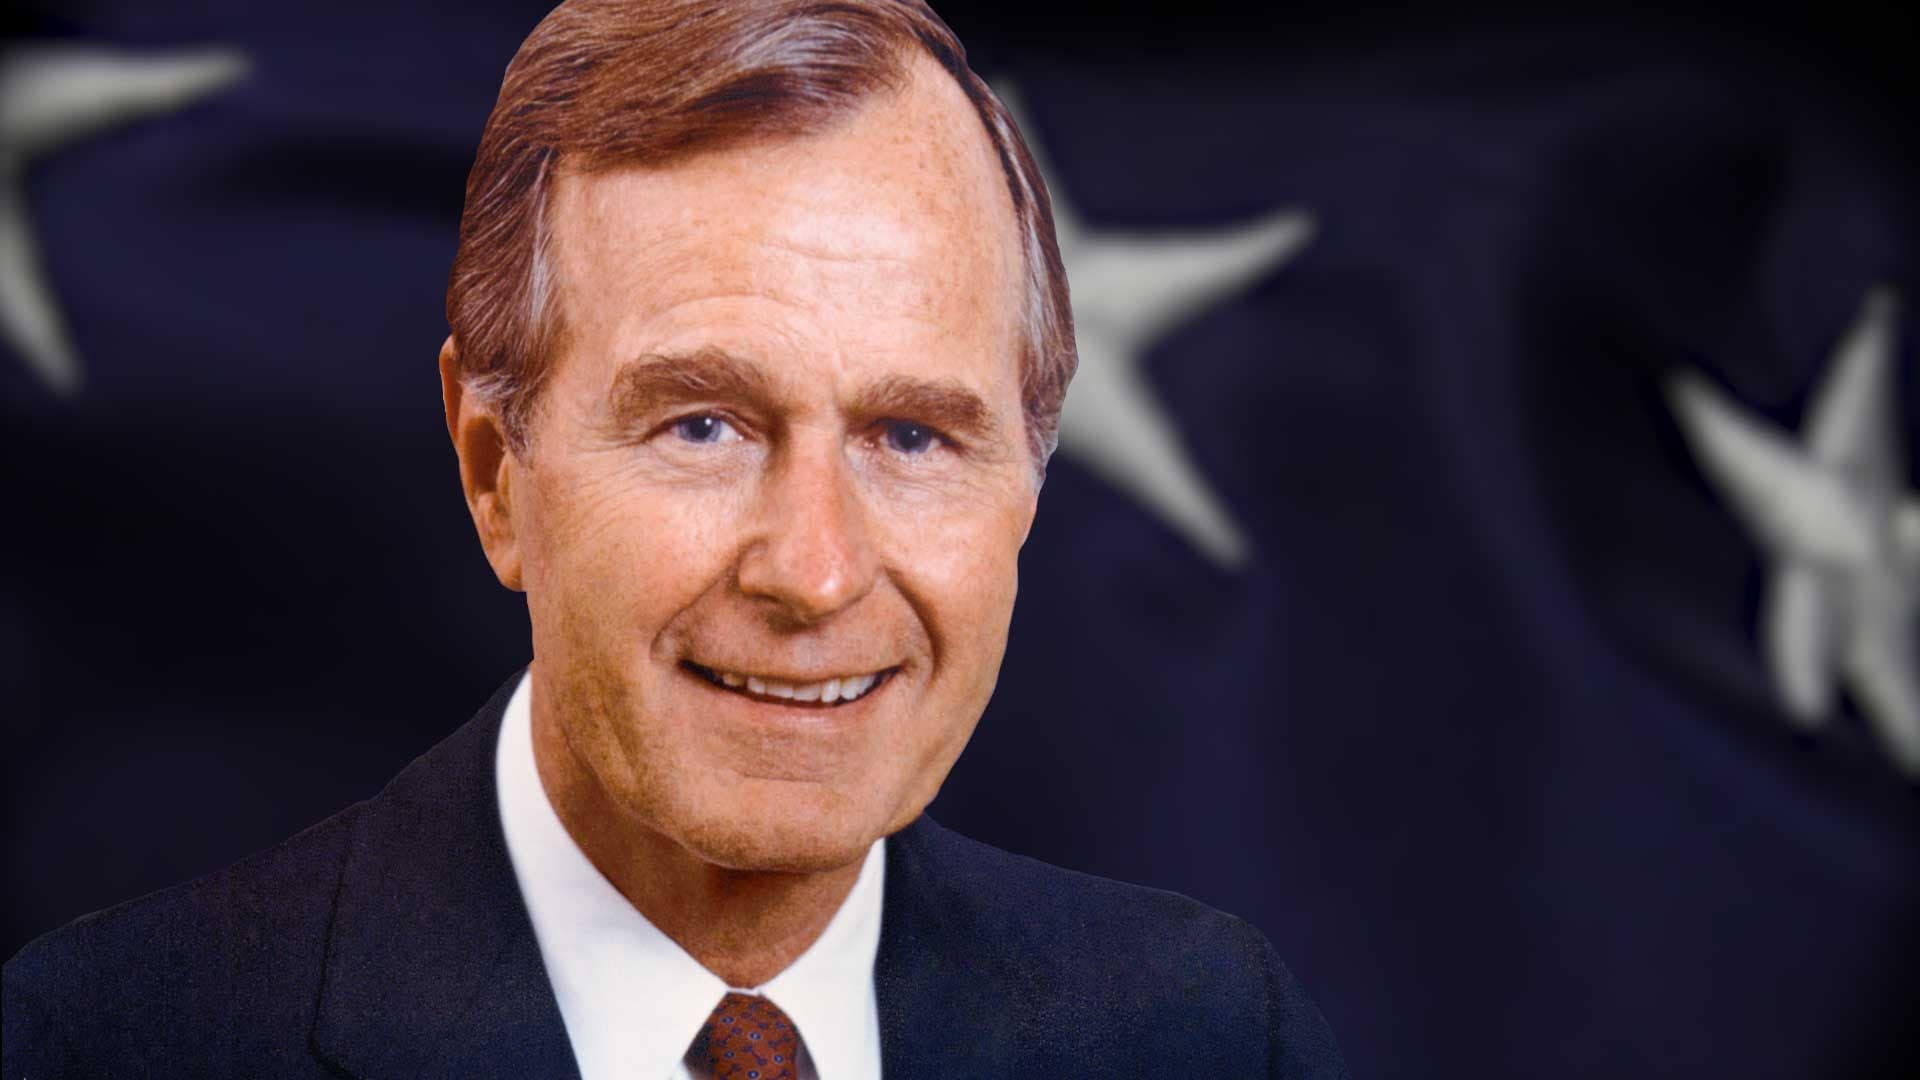
The Congressional Research Service puts total public debt at about $2.70 trillion near the beginning of George H.W. Bush’s presidency in January 1989 and roughly $4.17 trillion near the beginning of Bill Clinton’s presidency in January 1993.
That is an increase of about $1.47 trillion over four years, or approximately $367 billion per year in the dollars of the time. The period included a recession and the 1990 budget agreement, among other changes. Again, this figure measures the movement in gross debt between two Treasury snapshots rather than assigning each dollar to a particular law or decision.
Ronald Reagan: About $220 Billion Per Year

Total public debt was approximately $934 billion near the beginning of Reagan’s presidency in January 1981. By January 1989, it had risen to about $2.70 trillion. The difference was roughly $1.76 trillion over eight years.
That translates to an average nominal increase of about $220 billion per year. The number looks small beside today’s trillion-dollar annual changes, but the country, federal budget, price level, and existing debt were all much smaller. Gross federal debt nearly tripled in nominal terms across the eight-year span, which illustrates why comparing only raw dollars can dramatically understate the scale of older fiscal changes.
Bill Clinton: About $195 Billion Per Year

CRS puts total public debt at roughly $4.17 trillion near the beginning of Clinton’s presidency in January 1993. By Jan. 19, 2001, the balance was approximately $5.73 trillion. The nominal increase was about $1.56 trillion, averaging roughly $195 billion per year across eight years.
Clinton’s second term also included several years of federal budget surpluses. That does not mean gross federal debt simply disappeared. Debt held by the public declined during part of that period, while intragovernmental holdings continued to change as federal trust funds accumulated Treasury securities. It is a useful reminder that gross debt, debt held by the public, and the annual budget deficit are related measures, but they are not interchangeable.
Gerald Ford: About $71 Billion Per Year
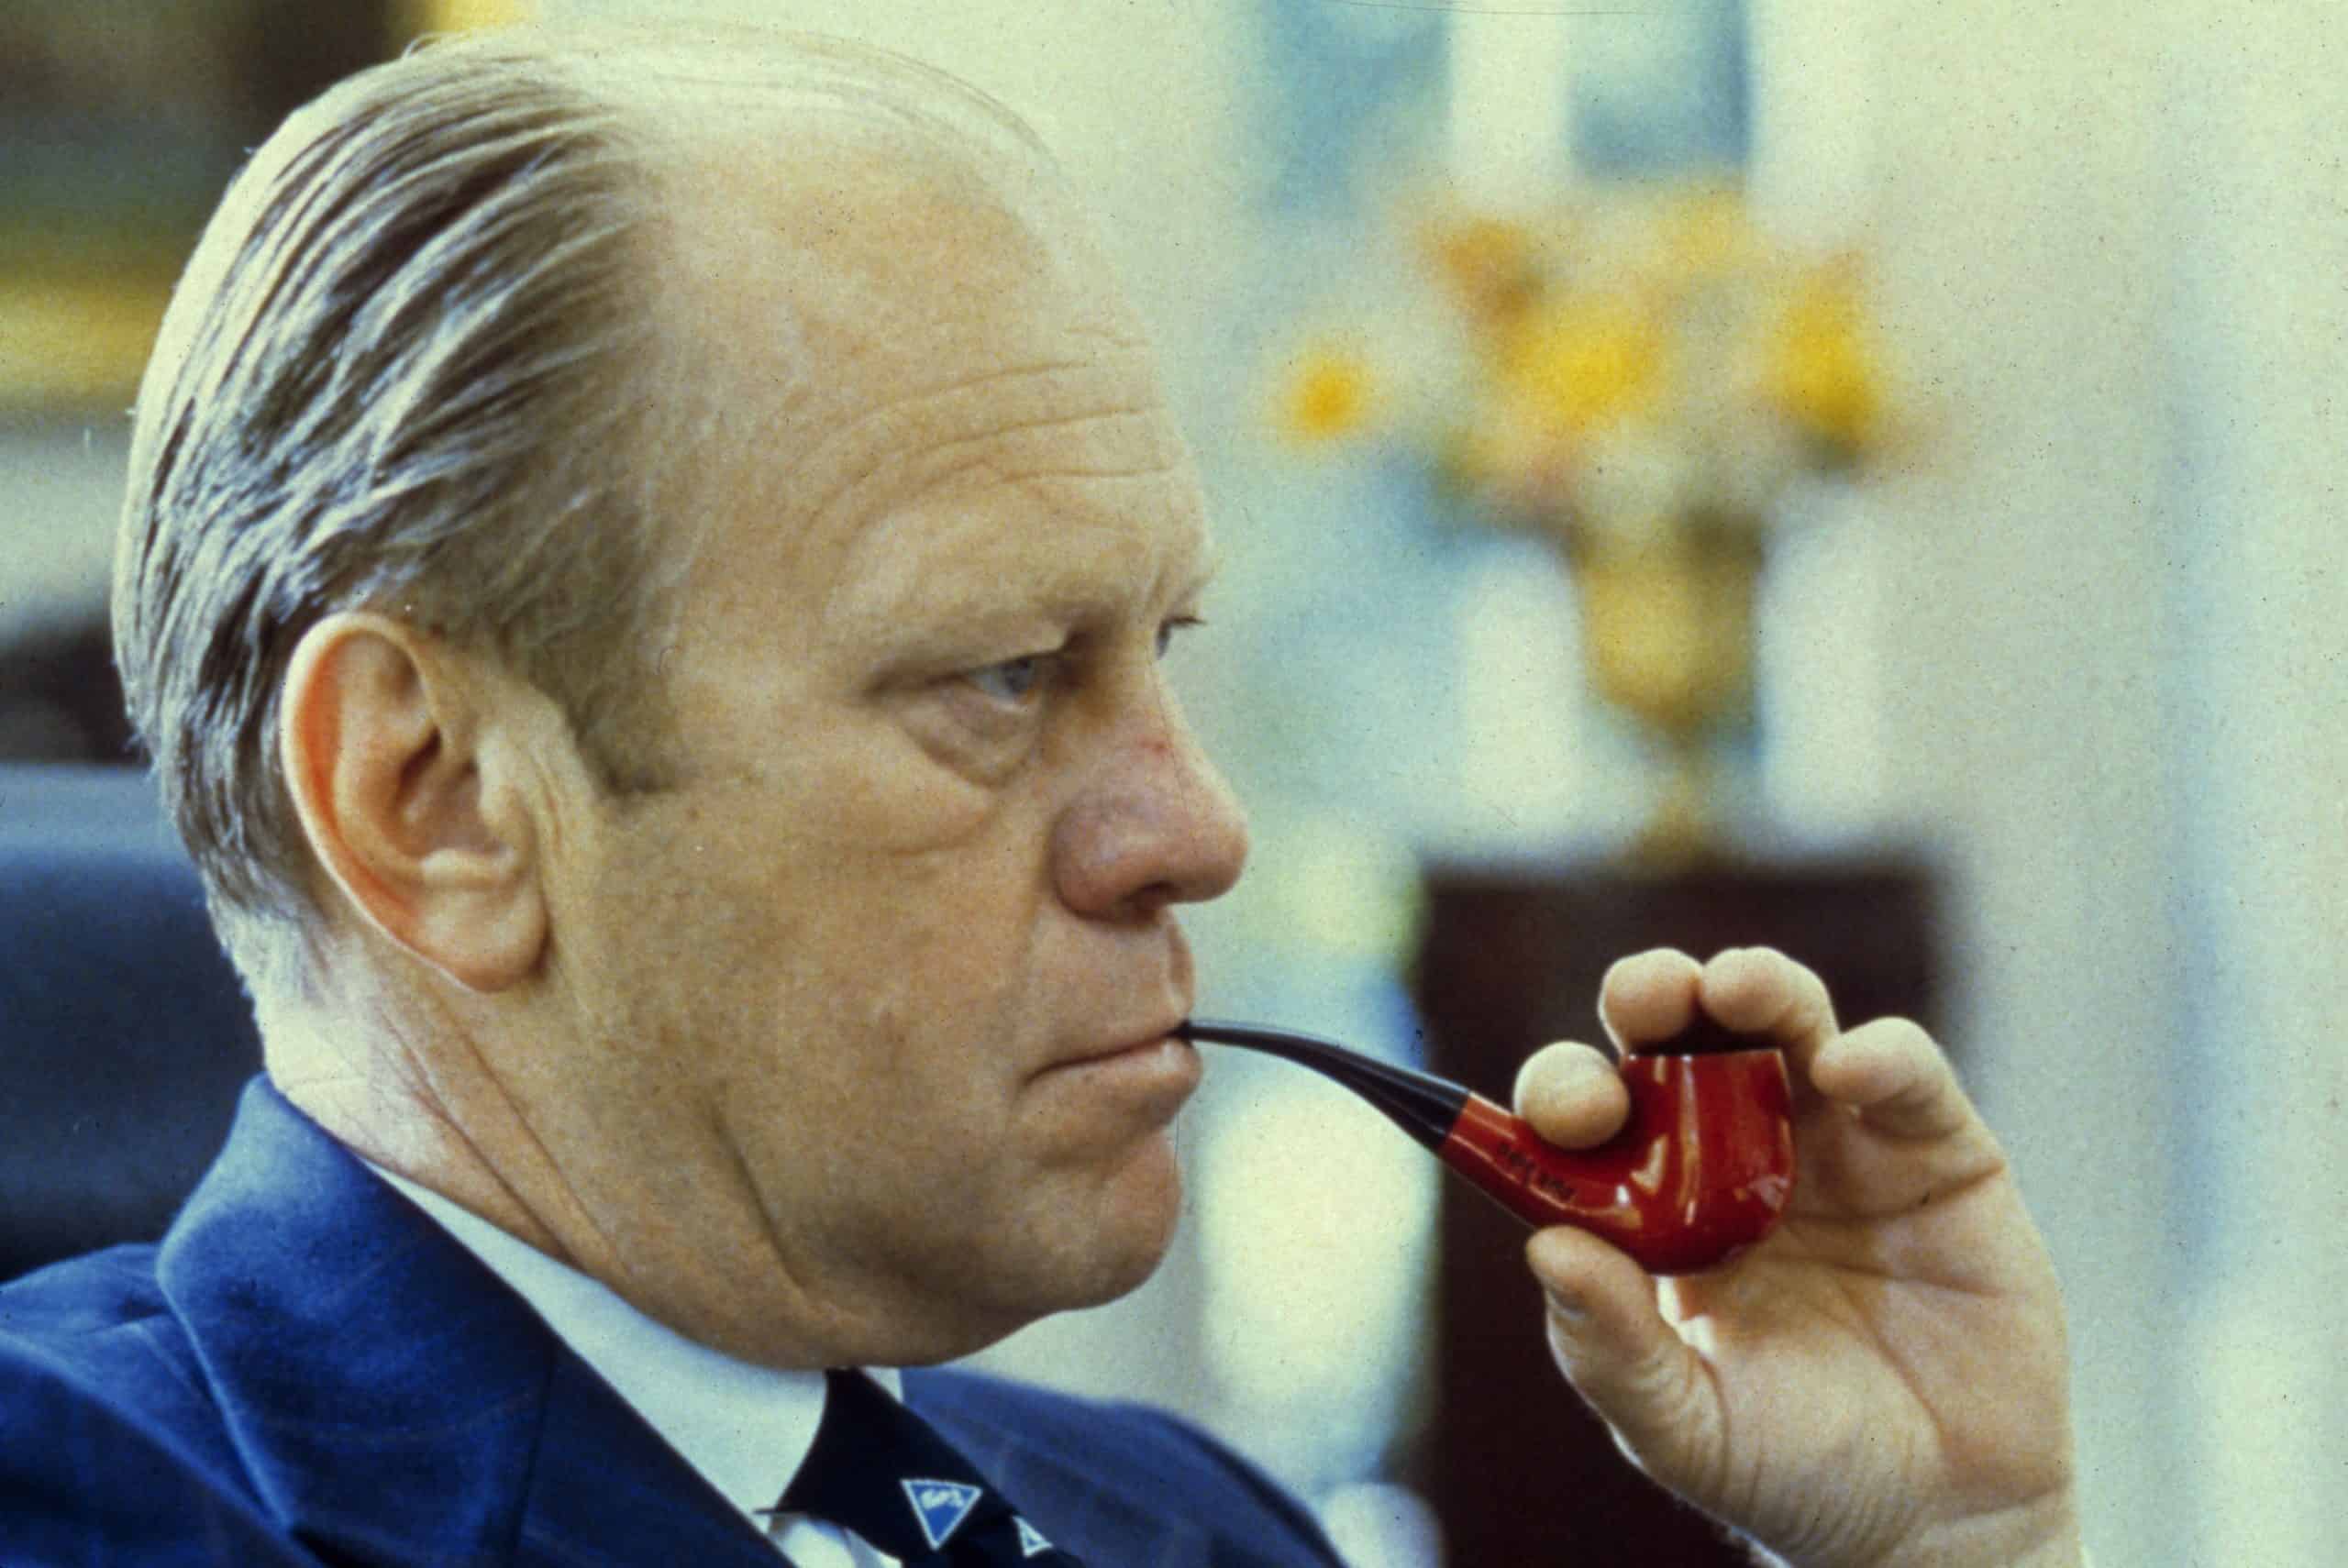
The original figures need a correction here. CRS uses approximately $475.3 billion in total public debt for July 31, 1974, shortly before Ford became president, and about $653.9 billion for Jan. 31, 1977, shortly after Jimmy Carter took office.
Using those inauguration-adjacent Treasury figures, gross debt increased by roughly $178.6 billion during an approximately two-and-a-half-year span. That works out to about $71 billion per year. Because daily debt data from this period are not available in the modern Treasury series, these month-end snapshots are necessarily less precise than the figures used for recent presidents.
Jimmy Carter: About $70 Billion Per Year

Total public debt was approximately $653.9 billion at the January 1977 month-end snapshot used by CRS. Four years later, the January 1981 figure was about $934.1 billion. That puts the nominal increase at roughly $280.2 billion during Carter’s presidency.
Spread across four years, the average comes to about $70 billion per year. That is slightly below the corrected Ford pace, rather than slightly above it as the original table suggested. Inflation was also unusually high during much of the late 1970s, making an unadjusted-dollar comparison with modern presidents especially limited.
Richard Nixon: About $21 Billion Per Year
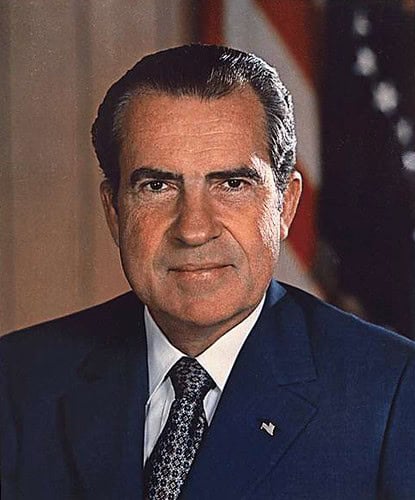
CRS reports about $359.4 billion in total public debt at the January 1969 month-end snapshot and roughly $475.3 billion in July 1974, shortly before Nixon resigned and Ford took office. That is an increase of approximately $115.9 billion.
Across roughly five and a half years, the increase averages about $21 billion annually in nominal dollars. Comparing that figure directly with a modern annual increase measured in trillions tells you as much about inflation and the enormous growth of the federal government and U.S. economy as it does about fiscal policy during either period.
Franklin D. Roosevelt Shows Why Nominal Dollars Can Mislead

Franklin D. Roosevelt is the clearest example of what gets lost when presidential debt comparisons use only unadjusted dollars. Federal debt at the end of fiscal 1933 was about $22.5 billion. By the end of fiscal 1945, after the Great Depression and most of World War II, it was approximately $258.7 billion.
That increase of about $236 billion works out to less than $20 billion per year across the 12-year span, a tiny figure beside modern debt changes. But the debt had increased by more than tenfold. No sensible comparison would conclude that the fiscal change surrounding the Depression and World War II was insignificant simply because today’s federal government can borrow $20 billion in a matter of days. Nominal-dollar comparisons are useful for showing the actual number of dollars added to the debt, but inflation-adjusted debt, debt held by the public, debt as a share of GDP, and annual deficits can tell very different parts of the story.
Contact [email protected] for any questions or corrections.