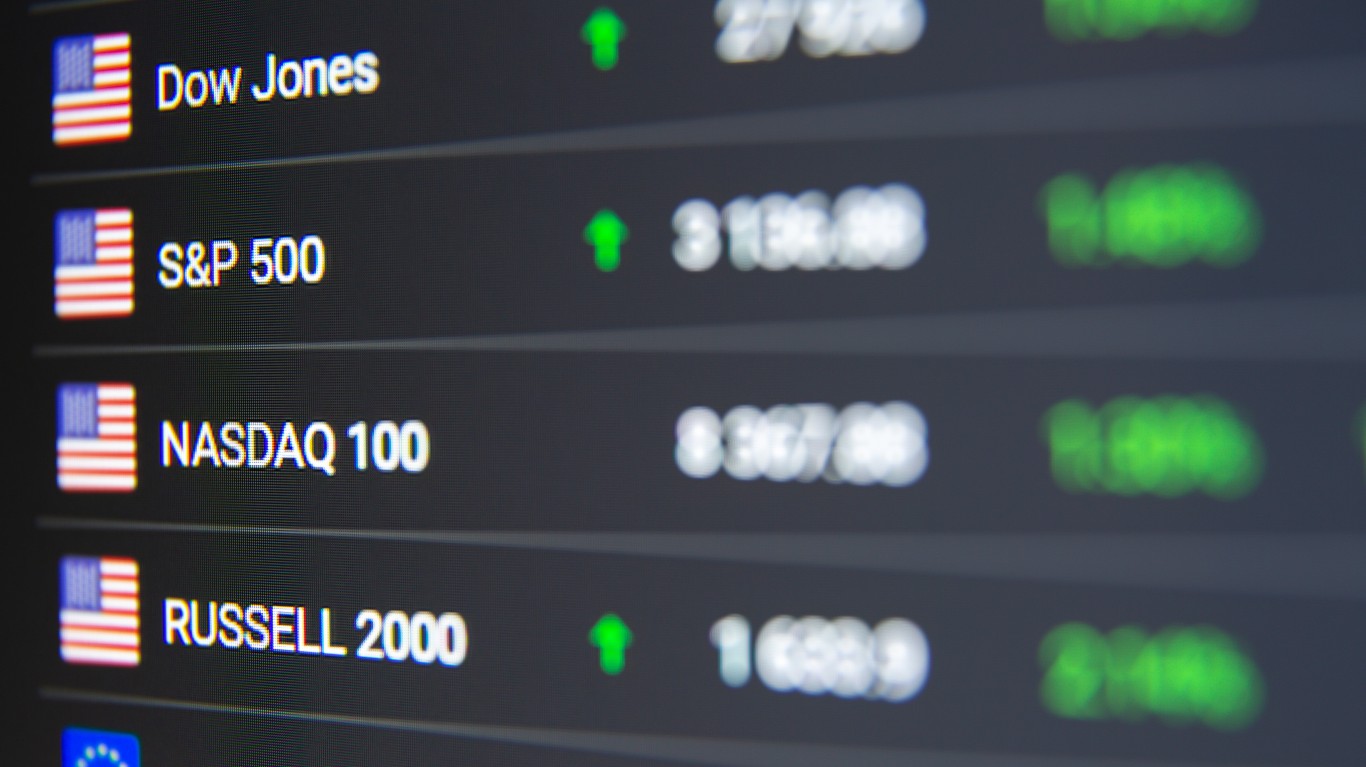
The Nikkei Crashed Nearly 5% Overnight. Will The NASDAQ Follow It Today?
Japan's Nikkei just cratered nearly 5% and South Korea's KOSPI fell even harder, but US premarket futures are barely flinching. Whether that calm holds when the opening bell rings at 9:30 a.m. depends on one critical question about where the…

The Nasdaq is feeling the overnight selloff, though so far much more mildly than Asia. As of about 6:08 a.m. ET, the SPDR S&P 500 ETF Trust (NYSEARCA:SPY) was down 0.25% at $767.64 in premarket trading. The fund tracks the 500 largest US companies.
The Invesco QQQ Trust (NASDAQ:QQQ), which tracks the 100 largest Nasdaq-listed companies, was down 1.09% at $720.99. Premarket trading is a thin session that runs before the 9:30 a.m. opening bell, so these readings can change before and after the open. Asia’s losses have been far steeper than America’s.
What Happened While You Were Asleep
The Economic Times reported that Japan’s Nikkei index fell nearly 5% overnight. Moneycontrol reported that South Korea’s KOSPI fell nearly 8%. Those outlets reported the numbers, which have not been independently verified. Both indexes trade overseas and appear here only as context.
Citing Reuters, The Economic Times linked the selling to concern over the financial health of a US cloud-computing provider and fears of higher interest rates after hotter-than-expected US inflation data. CNBC separately reported that worry about an AI borrowing binge was hitting that company’s bonds. Inflation data supports that worry. Consumer prices rose 3.7% in September from a year earlier, according to government labor data.
Why Wall Street Is Holding Up Better Than Asia
Overseas, The Economic Times reported a nearly 5% drop in Tokyo, and Moneycontrol reported nearly 8% in Seoul. In US premarket trading as of 6:08 a.m. ET, the S&P 500 fund was off 0.25% and the Nasdaq fund 1.09%.
The difference comes down to what each index holds, and most indexes weight companies by size, so whichever industries grow biggest end up taking over the index. A scare about AI hardware hits them hard. Japan’s and South Korea’s benchmarks are packed with chip and memory manufacturers and the equipment suppliers that serve them. The S&P 500 is more spread out. In one leading S&P 500 index fund, technology made up 38.0% of assets as of June 30. The rest included financials at 11.6%, health care at 8.9% and utilities at 2.2%. Banks, drugmakers and power companies have little to do with AI chip debt. The Nasdaq fund falls in between. Semiconductor companies crowd the top of its holdings list, which is why it is falling faster this morning.
What It Means for Your Retirement Account
Over the past week, the S&P 500 fund has slipped 1.23%. The Nasdaq fund has dropped 4.85%. If your 401(k) sits in a broad market index fund, your week has been much milder than it was for someone heavily invested in technology.
Both funds are still well ahead for the year. The S&P 500 fund is up 12.57% year to date, and the Nasdaq fund is up 17.37%. This has been a rough week inside a strong year, and for tech holders the week has been painful.
Will the Nasdaq Follow Asia? Our Answer
Our read is that this is a selloff focused on AI hardware, and it lacks the marks of a market-wide contagion. The selling would have to spread past chips. For the Nasdaq to follow Asia, it would need to reach banks, health care and retailers and pull the broad fund down along with tech. Options traders have yet to price that in.
The CBOE Volatility Index, Wall Street’s fear gauge, closed Tuesday at 15.27, inside its normal 15 to 20 range. The 10-year Treasury yield eased to 5.21% that day, a sign of modest demand for safe assets. Riding an AI mania is fine as long as you have planned the exit, which is the whole subject of our free bubble survivor’s handbook.
There are two things to check this morning. First, see whether the premarket decline deepens or fades as the market opens at 9:30 a.m., and second, see whether the Nasdaq fund keeps falling faster than the S&P 500 fund. If that gap holds, this remains an AI story. If the broad fund starts catching up and the fear gauge moves above 20, the selloff has spread to the rest of the market.
Contact [email protected] for any questions or corrections.
AJ spent 10 years writing about financial markets at The Motley Fool. His coverage centers on technology stocks and the broader macroeconomic trends, from interest rates to geopolitics, that shape where markets are headed next. AJ is drawn to the stories where big-picture economics and individual companies collide.