Why Is Bitcoin Dropping Today?

This post may contain links from our sponsors and affiliates, and Flywheel Publishing may receive compensation for actions taken through them.

Bitcoin (CRYPTO:BTC) trades near $77,400, down from $79,155 on September 9 and from an intraday peak of $82,000 on September 4, a fall of 2.2% and 5.6%, respectively. August CPI came in hot on September 11, and the rates market repriced the same day.
Bitcoin is fighting three things at once: a repriced September 16 rate hike, a run of ETF redemptions, and holders selling into every push toward $80,000. So what’s pushing Bitcoin lower with three trading days to go before the Federal Open Market Committee decision?
Hot Core Inflation Pushed Hike Odds to 83%
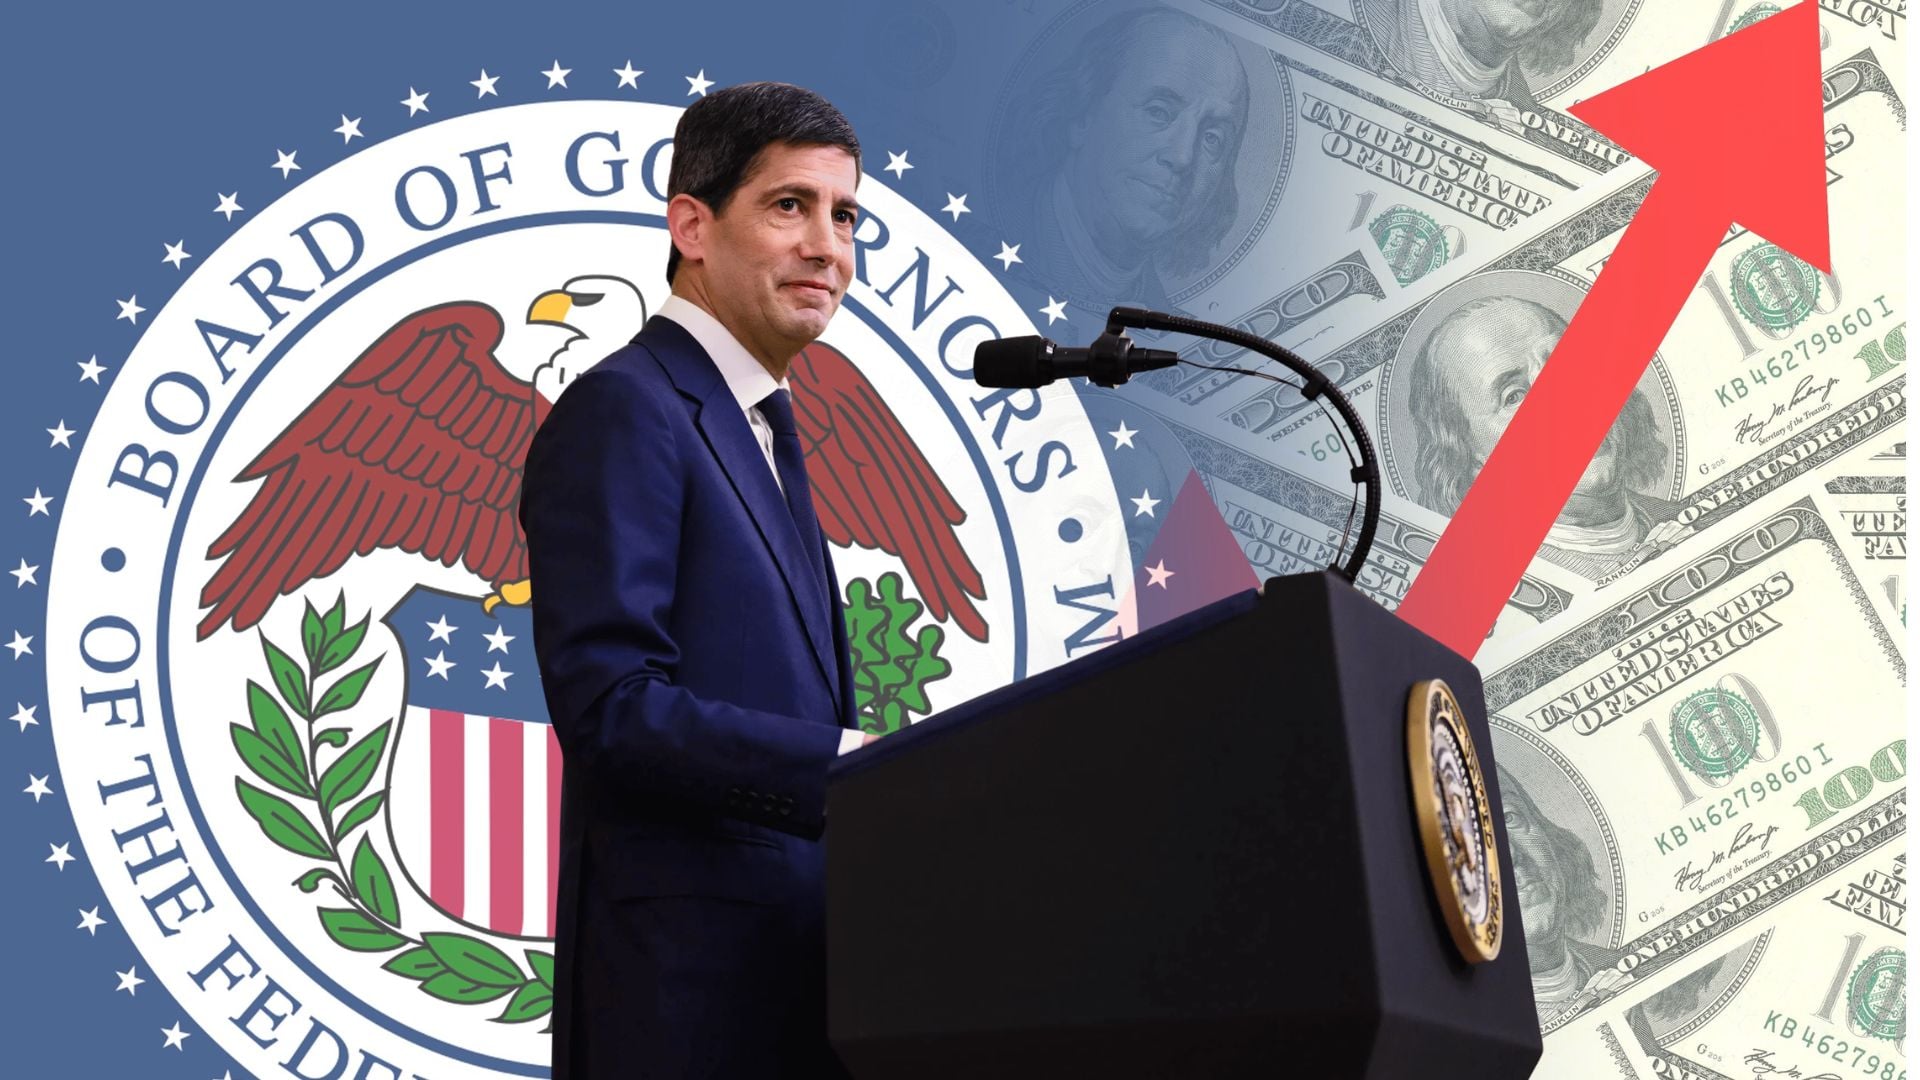
Core CPI, which measures inflation excluding food and energy, rose 0.3% month over month against 0.2% expected, and Polymarket moved the September 16 hike to 83% after the release. The Federal Reserve’s target rate upper bound stands at 3.75%, unchanged since December 2025.
Brent crude broke $100 a barrel on September 9, hours after US forces struck Iran-linked tankers near the Strait of Hormuz. Energy prices feed core inflation through transportation, packaging and manufacturing, so oil holding above $100 flowed straight into the August CPI report.
A hike would push bond yields higher, and when a government bond pays close to 5%, some savers move money out of coins that pay nothing. Bitcoin has no coupon and no cash flow, so the cost of holding it rises with yields. Higher inflation-adjusted yields also tighten financial conditions, and tighter conditions drain money from equities and crypto alike.
The market had spent August treating a cut as the more likely September outcome, and the CPI print took that off the table. The VIX closed at 17.84 on September 10, up 24.6% in a week, so equities repriced the same way.
Bitcoin ETFs Have Sold for Four Days Into a 539,000-Coin Wall

US spot Bitcoin ETFs lost $13.29 million on September 11, a fourth straight outflow day. The ETF inflow streak ended after the week to September 4 pulled in $986.9 million.
When ETFs redeem shares, the authorized participants sell Bitcoin to fund the redemption, so outflows translate into direct spot selling. One day of that size is small in isolation, but four in a row removes the passive buying that had been absorbing supply all summer.
Long-term holders sold 539,000 Bitcoin in the $77,000 to $80,000 zone this year, per CryptoQuant. Long-term holders are wallets that have held coins for more than 155 days, and most bought well below that range, so they sell into it instead of holding through it. Fresh buyers have to absorb that supply before Bitcoin can clear $80,000 with any conviction.
Where Does Bitcoin Go From Here?
Bitcoin’s next move probably rests on the $76,500 to $77,000 band, because that zone held on the CPI-day selloff and matches the lower edge of the 539,000-coin supply wall. A close under $76,500 would open $72,000 to $74,000, which is 7.0% below the current price. Bitcoin implied volatility trades near 40 into the decision, so options traders expect wider moves over the next 30 days than the market priced through most of the summer.
If the Fed sounds softer than a quarter-point hike implies, the yield pressure could ease, and ETF flows could turn positive. A hike with hawkish guidance would send Bitcoin toward the lower band instead. Bitcoin is dropping because oil pushed inflation higher, which repriced the Fed to an 83% hike bet, ETFs are redeeming for a fourth day, and holders keep selling into the $77,000 to $80,000 zone.
Contact [email protected] for any questions or corrections.
Sam Daodu is a crypto analyst and the editor of 24/7 Wall St.'s Crypto Desk, where he covers Bitcoin, XRP, Ethereum, Solana and the altcoins investors search for most. His work focuses on price levels, spot ETF flows, on-chain data and the regulatory decisions that move crypto markets, written so a first-time buyer and a seasoned trader can both use it.
Sam has written about crypto professionally since 2019 and has published more than 2,000 articles. Before joining 24/7 Wall St., he wrote for crypto media outlets and Web3 companies and ghostwrote for crypto founders and token launches. His analysis is syndicated on Yahoo Finance, MSN and AOL and has been cited by other crypto news sites. He also founded MacLabs Marketing, a content and personal branding agency for crypto founders and executives.
When he isn't reading charts, Sam is usually at the gym or watching One Piece, a series he maintains has better tokenomics than most altcoins.