SLV vs. SIVR: Same Silver, Lower Fee, So Which Physical Silver ETF Should You Actually Hold?
Two physical silver ETFs hold the exact same bullion, track the same price, and share the same tax trap, yet one charges nearly twice as much as the other. Before you assume the answer is obvious, there is a specific…

This post may contain links from our sponsors and affiliates, and Flywheel Publishing may receive compensation for actions taken through them.
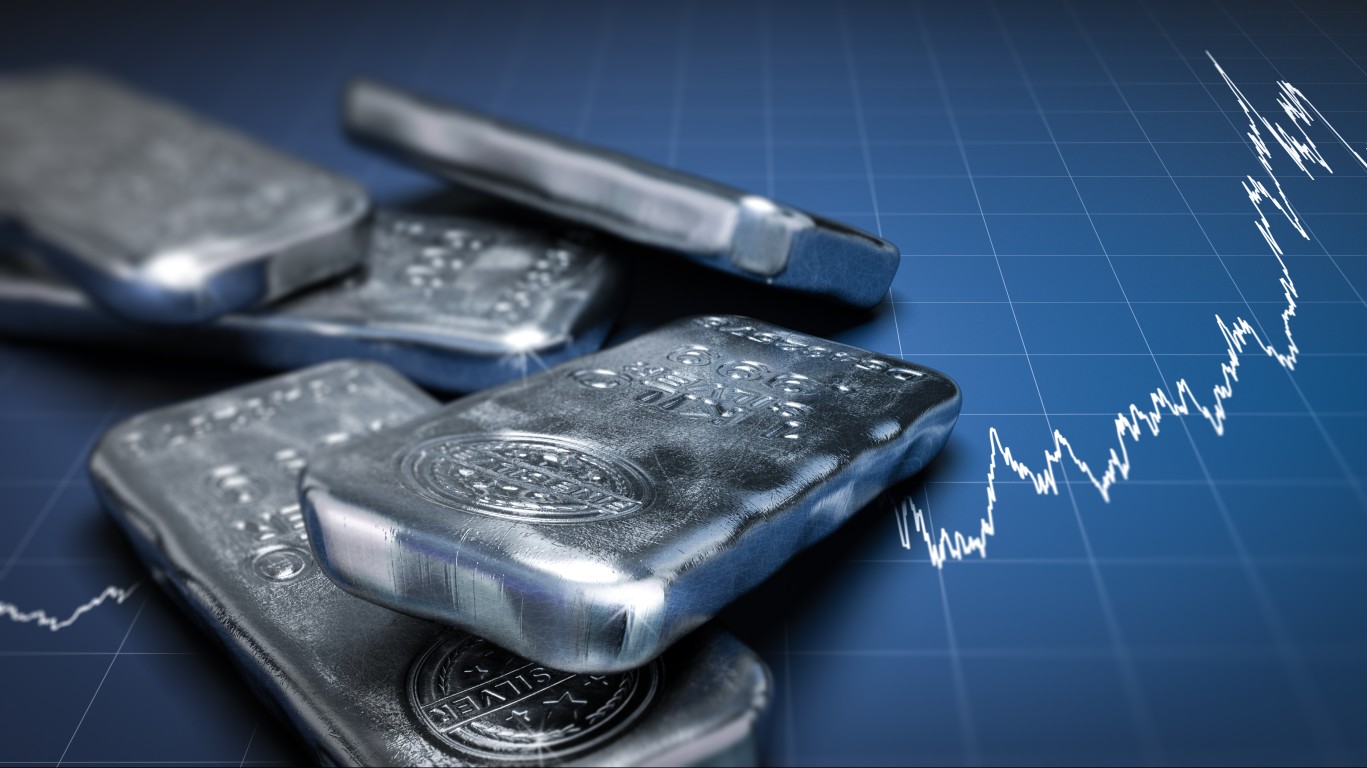
If you want physical silver exposure in a brokerage account, the choice usually narrows to two funds: the iShares Silver Trust (NYSEARCA:SLV) and the abrdn Physical Silver Shares ETF (NYSEARCA:SIVR). Both are grantor trusts backed by allocated bullion, both track the LBMA spot price, and their returns move almost in lockstep. Yet SIVR charges roughly 0.30% while SLV charges 0.50%. That 20-basis-point gap sounds trivial until you calculate what it costs a long-term holder, and until you ask what SLV actually gives you in return.
What Each Fund Is Actually Betting On
Both funds are pure bullion wrappers with an identical thesis: silver as an inflation hedge, monetary insurance, and industrial-demand play. Over the past year, that thesis has paid off. SLV is up 59.85% and SIVR is up 60.38%. Over five years, SLV returned 123.03% against SIVR’s 125.22%. Ten-year returns land at 182.61% for SLV and 188.16% for SIVR.
The tracking gap is small and consistent, and it lines up almost exactly with the fee differential. In other words, SIVR’s edge comes from charging less to hold the same metal, not from any construction advantage in the trust itself.
The Real Difference: Liquidity vs. Cost
SLV’s edge is scale. With net assets of roughly $28 billion against SIVR’s $3.9 billion, SLV trades with tighter bid-ask spreads, deeper order books, and a robust listed options market. If you write covered calls on your silver exposure, sell cash-secured puts to accumulate, or run any structured hedge, SLV is effectively the only game in town. SIVR’s options chain exists but is thin.
For a trader rotating in and out of silver, saving 20 basis points on the expense ratio is meaningless if you give it back on the spread or lose optionality entirely. SLV’s higher fee is the toll for institutional-grade liquidity.
Translating the Fee Gap Into Dollars
For a buy-and-hold investor, the math flips. On a $10,000 position, SIVR saves you about $20 a year. On $100,000 held for a decade, the drag differential compounds to roughly $2,000, ignoring price appreciation, which makes the gap larger in dollar terms as silver rises.
The Tax Trap Both Funds Share
Because both are grantor trusts holding physical metal, the IRS treats gains as collectibles. Long-term gains are taxed up to 28%, not the 20% ceiling that applies to equity ETFs. Neither fund escapes this. If you are holding silver in a taxable account, expect a heavier tax bill than a comparable stock position, and consider whether an IRA is the better wrapper.
Side by Side
| Metric | SLV | SIVR |
|---|---|---|
| Expense ratio | 0.50% | 0.30% |
| Approx. AUM | $28B | $3.9B |
| 1-year return | 59.85% | 60.38% |
| 5-year return | 123.03% | 125.22% |
| Options market | Deep | Thin |
| Tax treatment | Collectibles (28% max) | Collectibles (28% max) |
The Verdict
For a long-term holder building a strategic silver allocation, SIVR is the lower-cost wrapper. Same bullion, same tax profile, lower ongoing drag. There is no scenario in which paying an extra 20 basis points annually to hold identical metal makes sense if you never trade options and rarely rebalance.
SLV earns its higher fee only for investors who need what its scale provides: tight spreads at size, an active options chain, and the ability to move institutional positions without impact. Traders and hedgers get more utility from SLV, while buy-and-hold silver bugs get more from SIVR. What would flip the call is a fee cut from BlackRock, which would erase the case for SIVR overnight.
Contact [email protected] for any questions or corrections.
After 15 years on Wall Street with 7 of them as Director of Corporate and Municipal Bond Trading for a NYSE member firm, I started my own project and corporate finance consultancy. Much of the work involves writing business plans, presentations, white papers and marketing materials for companies seeking budgetary allocations for spinoffs and new initiatives or for raising capital for expansion or startup companies and entrepreneurs. On financial topics, I have been published under my own byline at The Motley Fool, 247wallst.com, DealFlow Events’ Healthcare Services Investment Newsletter and The Microcap Newsletter, among others. Additionally, I have done freelance ghostwriting writing and editing for several financial websites, such as Seeking Alpha and Shmoop Financial. I have also written and been published on a variety of other topics from music, audiophile sound and film to musical instrument history, martial arts, and current events. Publications include Copper Magazine, Fidelity (Germany), Blasting News, Inside Kung-Fu, and other periodicals.