SMH’s Price Has Soared, but Its Payout Is Still Below 2022 Levels
SMH has handed long-term holders a staggering price run, yet the fund's annual payout tells a quietly unsettling story that most investors overlook when the share price keeps climbing.

This post may contain links from our sponsors and affiliates, and Flywheel Publishing may receive compensation for actions taken through them.
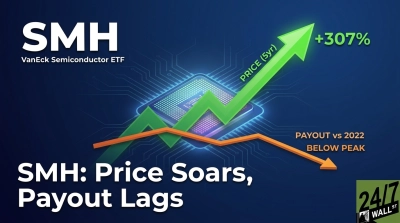
VanEck Semiconductor ETF (NASDAQ:SMH) has gained 47% year to date and 54% over the past year. Its payout has moved far less. Trailing 12-month distributions total $1.10 per share, up just 3% from the prior period.
At a price near $528, that comes to a trailing yield of roughly 0.2%. The fund tracks the MVIS U.S.-Listed Semiconductor 25 Index and holds about $75 billion in net assets. For retirees, the real question is whether a payout that still trails its 2022 level can do any work in an income portfolio.
One Check a Year, Adjusted for the Split
The fund pays once a year, in late December in recent years, so every comparison rests on annual payments. The income stems from ordinary dividends that its chip holdings pay out; most of those companies put the bulk of their cash back into the business.
The fund completed a 2-for-1 forward split effective May 5, 2023. The December 2022 payment was originally $2.40 per share, which equals $1.20 after adjusting for the split. The apparent drop in 2023 is purely a split effect: holders owned twice as many shares, so their total income held up.
2025 Payout Still Trails Its 2022 Peak
| Year | Annual Payment Per Share (Split-Adjusted) |
|---|---|
| 2020 | $0.75 |
| 2021 | $0.79 |
| 2022 | $1.20 |
| 2023 | $1.04 |
| 2024 | $1.07 |
| 2025 | $1.10 |
The 2025 payment came in 8% below the split-adjusted 2022 figure. In this history, 2022 stands out as a spike. The three payments since have inched higher each year but have yet to recover it.
Five Years of Price Gains Against a Slower Payout
Over five years, the fund’s price is up 307%. On a calendar basis, the annual payout rose 40% from 2021 to 2025. The windows differ, so the comparison is approximate, yet it explains the shrinking yield: price has grown much faster than income.
Biggest Positions Pay the Smallest Dividends
Holdings reflect the fund’s June 30, 2026, filing and may have changed since then. The top 10 positions account for about 70% of assets.
- Nvidia (NASDAQ:NVDA | NVDA Price Prediction): 18% weight, 0.1% yield. Its $0.28 annual dividend uses about 4% of EPS, so the payout is extremely safe and also tiny.
- Taiwan Semiconductor Manufacturing (NYSE:TSM): 9% weight, 0.9% yield, the biggest income source in the group, backed by a 51% profit margin.
- Advanced Micro Devices (NASDAQ:AMD): 6% weight and no dividend at all, so this position contributes nothing to the fund’s distribution.
- Broadcom (NASDAQ:AVGO): 5% weight, 0.8% yield. Its $2.60 dividend uses about 35% of EPS. That makes it the closest call in the group, yet coverage still leaves ample room.
- Micron Technology (NASDAQ:MU): 5% weight, 0.1% yield. The dividend consumes under 1% of EPS of $74.33, though memory pricing is notoriously cyclical.
Every dividend here looks well covered. The limit is scale: with yields this low among the largest weights, income per dollar invested stays small even when every dividend holds firm.
Verdict: Safe Income, Thin Income
The distribution is durable because the companies paying it are very profitable and pay out little. Long-term holders have collected a 1,590% price gain over 10 years while the payout has remained roughly flat. A new buyer gets about 20 cents of annual income per $100 invested.
For growth-oriented holders, the VanEck fund’s dividend functions as a bonus. Retirees needing reliable cash flow, along with high-yield income plans, will find this payout too small to carry the load.
Contact [email protected] for any questions or corrections.
Trey has been an editor and author at 24/7 Wall St. for more than a decade, where he has published thousands of articles analyzing corporate earnings, dividend stocks, short interest, insider buying, private equity, and market trends. His comprehensive coverage spans the full spectrum of financial markets, from blue-chip stalwarts to emerging growth companies.
Beyond 24/7 Wall St., Trey has created and edited financial content for Benzinga and AOL's BloggingStocks, contributing additional hundreds of articles to the investment community.
Trey's editorial expertise extends across multiple publishing environments. He served as production editor at Dearborn Financial Publishing and development editor at Kaplan, where he helped shape financial education materials. Earlier in his career, he worked as a writer-producer at SVE. His freelance editing portfolio includes work for prestigious clients such as Sage Publications, Rand McNally, the Institute for Supply Management, the American Library Association, Eggplant Literary Productions, and Spiegel.
Outside of financial journalism, Trey writes fiction and has been an active member of the writing community for years, moderating workshop sessions at regional conventions.