How to Build $1,000 a Month in Dividend Income
A thousand dollars a month can cover a car payment, a midrange health insurance premium, utilities, internet, and phone bills, or fund home renovations or travel. Replacing that with dividend income requires a specific amount of capital, and the number…

This post may contain links from our sponsors and affiliates, and Flywheel Publishing may receive compensation for actions taken through them.

A thousand dollars a month can cover a car payment, a midrange health insurance premium, utilities, internet, and phone bills, or fund home renovations or travel. Replacing that with dividend income requires a specific amount of capital, and the number can vary by roughly threefold depending on the yield bucket you choose. The math below shows what $12,000 a year in passive income costs at three different risk levels, using yields available in the market today.
The benchmark to beat is the 10-year Treasury, which currently sits around 4.55%. Any income collected from a stock or fund needs to justify the extra risk taken on top of that risk-free coupon. Inflation compounds the challenge: the income stream built today must grow each year just to preserve its real purchasing power.
Conservative Tier: 3% to 4% Yield
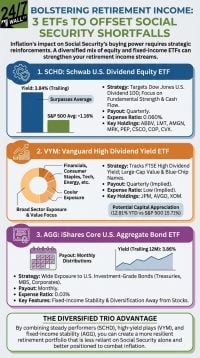
This is the dividend growth bucket. Schwab U.S. Dividend Equity ETF (NYSEARCA:SCHD) is a flagship example, with roughly $95 billion in net assets and an expense ratio of just 6 basis points. Holdings span healthcare, energy, telecom, and consumer staples, with no single name exceeding 4% of the fund.
At a 3.5% yield, generating $12,000 a year requires roughly $343,000 in capital. That is the highest upfront cost of the three tiers, and it buys the slowest current income. The tradeoff is stability: broad diversification, a payout that has historically grown each year, and a principal balance that tends to appreciate alongside the dividend. For investors who can stomach a lower starting yield, the growth profile does the heavy lifting over time.
Moderate Tier: 5% to 7% Yield
This bracket is where REITs, MLPs, and high-dividend equity funds live. Realty Income (NYSE:O) yields about 5.3%, pays monthly, and currently distributes $0.2705 per share. As of March 2026, the company has logged 114 consecutive quarterly dividend increases, underscoring the consistency that draws income investors to the name. At a 5% yield, generating $12,000 a year requires about $240,000.
Enterprise Products Partners (NYSE:EPD | EPD Price Prediction) offers a different flavor of midstream income. The partnership raised its quarterly distribution to $0.56 per unit in July 2026, a 2.8% increase, extending its streak to 28 consecutive years of distribution growth. The current yield sits near 5.7%, meaning roughly $211,000 in capital generates the target $12,000 annually. The structural catch is the K-1 tax form that partnership investors receive each year, which can complicate filing.
A blended moderate portfolio averaging 6% needs about $200,000 to generate $1,000 a month. Dividend growth is slower than in the conservative bucket, and REIT and MLP units tend to trade on interest rate direction more than on broad equity sentiment.
Aggressive Tier: 8% to 10% Yield
Ares Capital (NASDAQ:ARCC), the largest publicly traded business development company, yields approximately 10.2% and pays a $0.48 quarterly dividend that has held steady since 2023. At that yield, producing $12,000 a year demands only about $118,000 in capital. That is the lowest entry price of the three tiers by a wide margin.
The lower capital requirement comes with real credit risk. ARCC’s NAV has drifted lower, and non-accrual positions have risen over the past two years. BDC distributions are taxed as ordinary income, and credit downturns can force dividend cuts. The flat $0.48 quarterly payout also means no built-in inflation hedge: the income stream holds still while everything else gets more expensive.
The Compounding Trap Most Income Investors Miss
A 3.5% yield growing 8% a year roughly doubles in nine years. A flat 10% yield does not move. Over a decade, that gap translates to the difference between $1,000 a month becoming $2,000 a month and $1,000 a month sitting still while inflation chips away at its value.
The comparison between SCHD and ARCC illustrates the point. Both have delivered similar long-term total returns over the past decade, but the paths diverged sharply. ARCC distributed far more cash along the way, while SCHD delivered stronger payout growth from a lower starting yield. Over long periods, lower-yield assets with rising payouts can match or beat high-yield assets with static income, depending on how distributions are reinvested and taxed.
For investors who cannot deploy $200,000 today, dollar-cost averaging is a practical path forward. Investing $750 a month at an 8% blended return reaches roughly $500 a month in dividend income by year 12, $750 a month by year 15, and the full $1,000 by year 18.
Three Things to Do This Week
- Start with your actual annual spending rather than gross salary. Most retirees need to replace less income than they assume because payroll taxes and savings contributions disappear once you stop working.
- Compare a dividend growth fund’s 10-year total return against a high-yield BDC or covered call fund over the same period. The compounding effect on payout and price is usually the deciding factor, and the gap widens further once taxes are applied.
- Model the tax impact in your bracket. REIT and BDC distributions are taxed as ordinary income, MLPs issue K-1s, and qualified dividends from broad equity ETFs get the preferential rate. The after-tax yield is what actually funds your $1,000 a month.
Editor’s note: This update corrects SCHD’s net assets to approximately $95 billion (from $71.6 billion), raises the 10-year Treasury yield reference to roughly 4.55%, updates Realty Income’s consecutive quarterly dividend increase count to 114, and reflects Enterprise Products Partners’ most recent quarterly distribution of $0.56 per unit and its 28-year distribution growth streak.
Contact [email protected] for any questions or corrections.
Drew Wood has edited or ghostwritten nine books and published more than 1,500 articles on investing, business, politics, travel, world cultures, wildlife, and earth science. He holds a doctorate and four master's degrees and has nearly 30 years of college teaching experience. His travels have taken him to 25 countries, including three years living in Ukraine.