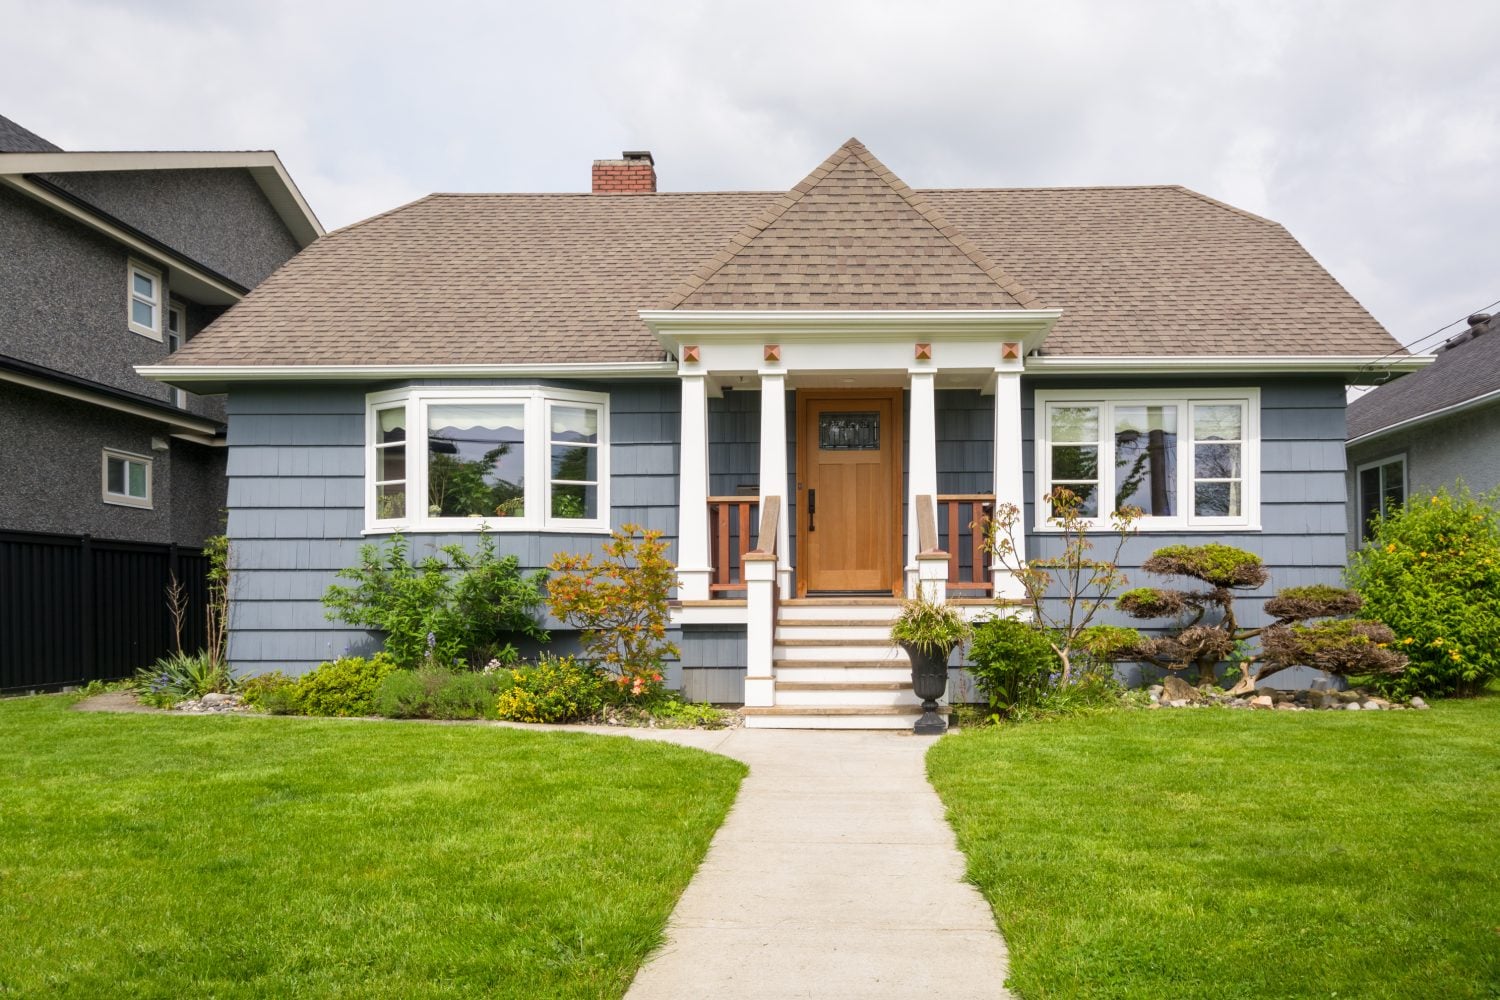
A single-family rental property in Toledo purchased for $135,000 at a 9% gross cap rate would generate roughly $12,150 annually in gross rental income. After accounting for property taxes, insurance, vacancies, maintenance, and property-management costs, the net cash flow may fall closer to $5,400 per year. To replace $400,000 annually with that level of net income, you’d have to buy the whole neighborhood: roughly 74 similar properties. A dividend portfolio can potentially generate the same cash flow without tenants, maintenance calls, or scattered real-estate operations.
The underlying math is identical to what every real-estate investor uses: divide the target income by the expected yield to determine the capital required. The real differences emerge in the tradeoffs. Higher-yield approaches may reduce the amount of capital needed, but they often introduce greater volatility, slower growth, or higher risk. Lower-yield strategies generally require more capital upfront while offering stronger long-term appreciation and income growth. The choice ultimately becomes a balance between income, stability, and peace of mind.
The Conservative Tier: 3% to 4% Yield
At a 3.5% yield, $400,000 divided by 0.035 equals roughly $11.43 million. At 4%, it is an even $10 million. This is the dividend growth lane: broad dividend ETFs and aristocrat names like Johnson & Johnson (NYSE:JNJ | JNJ Price Prediction) and the Schwab U.S. Dividend Equity ETF (NYSEARCA:SCHD).
JNJ pays a 2.3% yield after raising its quarterly dividend to $1.34, its 64th consecutive annual hike. SCHD spreads $71.6 billion across names like Merck, Chevron, and Coca-Cola at a 6 basis point expense ratio. Capital required is highest, but principal tends to appreciate and the income stream rises faster than inflation.
The Moderate Tier: 5% to 7% Yield
At 6%, $400,000 divided by 0.06 equals roughly $6.67 million. At 7%, $5.71 million. This is REIT and high-dividend equity territory, where the cleanest rental property analog lives: Realty Income (NYSE:O).
Realty Income pays $0.2705 a share every month, an annualized rate of $3.234 for a 5.2% yield at $61.71. Q1 2026 AFFO per share rose 7% to $1.13 and management raised full-year guidance to $4.41 to $4.44. Portfolio occupancy sits at 99% across thousands of net-leased properties. Compared with one Toledo house, you get instant geographic and tenant diversification, monthly cash, and the ability to sell in a click instead of a quarter.
The Aggressive Tier: 8% to 12% Yield
At 9%, $400,000 divided by 0.09 equals about $4.44 million. At 12%, $3.33 million. This is the BDC, mortgage REIT, and leveraged covered call lane. Ares Capital (NASDAQ:ARCC) is the headline name, the largest publicly traded business development company.
ARCC yields 10.2% on a $1.92 annual payout. Q1 2026 revenue jumped 71% to $763 million, but $412 million in net unrealized losses dragged GAAP EPS to $0.13 and NAV per share slipped to $19.59 from $19.94. Shares are down 6% over the past year. The story of this tier is current income: you are spending the asset rather than living off its appreciation.
The Insight Buried in the Math
Chasing the highest available yield often looks attractive at first but can weaken long-term income durability. Johnson & Johnson, for example, yields only about 2.3%, yet a dividend growing at a historical mid-single-digit pace can roughly double the income stream within a decade. By contrast, a 10% yield with flat or declining distributions, common among some BDCs and mortgage REITs during difficult credit cycles, may generate the same $400,000 in year one but struggle to maintain that purchasing power over time.
Over the past decade, Johnson & Johnson delivered roughly 165% price appreciation compared with about 217% for Ares Capital Corporation. The gap appears narrower than many investors expect, especially considering that ARCC required a much higher ongoing distribution to achieve those returns. With the 10-year Treasury yielding around 4.6%, investors demanding equity-level risk need to evaluate whether the additional yield meaningfully compensates for volatility, credit exposure, and potential payout instability.
Three Steps Before You Buy Anything
- Calculate your actual annual spending, not the $400,000 headline. Most households need to replace less than their salary once payroll taxes and savings come out, which cuts the required capital meaningfully.
- Compare the 10-year total return of a 3.5% dividend growth fund against a 10% high-yield vehicle in your own brokerage screener. The compounding gap is the entire argument against reaching.
- Run the tax math. Qualified dividends, REIT ordinary income, and BDC distributions are taxed differently, and rental cash flow gets a depreciation shield none of these do.
A Toledo landlord with three houses clears about $16,200 a year and answers the phone when the furnace dies. A $400,000 dividend portfolio at 6% pays $24,000 and never calls. Which would you choose?
Contact [email protected] for any questions or corrections.