A $500,000 position generating a 7% blended yield produces $35,000 in annual income, or about $2,917 per month. That is the arithmetic behind the headline and the same calculation a 62-year-old retiree might use when evaluating how much of a portfolio to allocate to floating-rate credit. Senior bank loans generate income from loans whose interest payments adjust with short-term rates, making them distinct from traditional fixed-rate bonds. In an environment where the 10-year Treasury yields roughly 4.5% and inflation remains elevated, many income investors view floating-rate loans as a way to maintain income potential while reducing interest-rate sensitivity.
The Income Target and the Capital It Requires
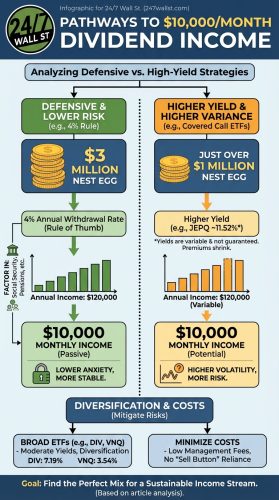
The core equation does not change: income target divided by yield equals capital required. For $35,000 of annual income, the capital needed scales directly with whatever yield you accept.
- At 3.5%, you need $1,000,000 invested.
- At 7.0%, you need $500,000 invested.
- At 12.0%, you need roughly $291,667 invested.
The 7% line is where senior loan ETFs, floating-rate mutual funds, and business development companies (BDCs) currently sit. That is also where most retirees first meet a real tradeoff between current income and principal stability.
Conservative Tier: 3% to 4% Yield
This is the dividend-growth and broad-market range. $35,000 divided by 0.035 equals $1,000,000 of capital. The instruments here are diversified equity index funds, dividend aristocrat ETFs, and high-quality corporate bond funds. Distributions grow over time, principal tends to appreciate, and inflation gets absorbed by both rising payouts and capital gains. The cost is upfront: you need twice the capital of the moderate tier to clear the same $35,000.
Moderate Tier: 5% to 7% Yield, Where Senior Loans Live
This is the tier the headline targets. $35,000 divided by 0.07 equals $500,000. Senior bank loans, syndicated leveraged loans, preferred shares, and certain covered-call equity income funds populate this range. Senior loans specifically are below-investment-grade corporate debt (typically BB to B credit) with coupons that reset every 30 to 90 days against SOFR or prime, which currently anchors near the 3.75% Fed funds upper bound.
Three vehicles map cleanly to this tier. Blackstone Senior Floating Rate 2027 Term Fund (NYSE:BSL) is a closed-end fund with a 2027 termination date, which gives investors a defined wind-down path. For BDC-style exposure inside the same yield band, Invesco Senior Loan ETF (NYSEARCA:BKLN) and SPDR Blackstone Senior Loan ETF (NYSEARCA:SRLN) both run SEC yields near 7.5%, broadly diversified across hundreds of loans.
Aggressive Tier: 8% to 14% Yield
Going higher means leaning on BDCs, mortgage REITs, and leveraged covered-call funds. Blackstone Secured Lending Fund (NYSE:BXSL | BXSL Price Prediction) reported a Q1 2026 dividend of $0.77 per share against a NAV near $26, an 11.7% annualized yield on net asset value. Ares Capital (NASDAQ:ARCC), the largest publicly traded BDC, pays $0.48 quarterly, or $1.92 annually.
At those yields, $35,000 of income requires closer to $300,000 of capital. The cost shows up in principal: BXSL is down roughly 16% over the past year, ARCC is down about 5%, and non-accruals have crept up at both. High current yield, lower total return.
Current Income vs. Future Income
A high yield can be appealing, but current income and long-term income growth are not the same thing. A 3.5% yield growing at 8% annually doubles its income stream in roughly nine years, while a higher-yield investment with little or no distribution growth may generate more cash upfront but less growth over time. For a 62-year-old with a 25-year investment horizon, a lower-yield, dividend-growth strategy can ultimately produce more cumulative income despite the smaller initial payout. Senior loans address a different objective. Their floating-rate structure can help protect income when interest rates remain elevated, providing current cash flow and reduced rate sensitivity while longer-term compounding strategies develop.
What to Do With This Math
- Cap senior-loan exposure at 15% to 20% of the portfolio. The 2009 default cycle saw 5% to 8% default rates in this asset class, and prices behaved like equities, not bonds.
- Compare 10-year total return (not just yield) between a 3.5% dividend-growth fund and a 10%+ BDC. The growth fund frequently produces more cumulative income once dividend increases compound.
- Model the tax drag. BDC and senior-loan distributions are largely ordinary income, which lands harder in a high bracket than qualified dividends or municipal coupons.


Contact [email protected] for any questions or corrections.