How Large Does Your Portfolio Need to Be to Generate $30,000 a Month?
Replacing a six-figure income with portfolio yield sounds straightforward until you realize the required capital swings by millions depending on which yield tier you choose, and the tier that looks cheapest today often costs the most over 20 years.


Thirty thousand dollars a month is $360,000 a year. That figure sits well above the $68,958 per capita disposable personal income the Bureau of Economic Analysis recorded for the second quarter of 2026, and it’s roughly five times the $78,535 the average U.S. household spent annually in 2024. It’s the income of a senior partner, a successful founder, or a two-earner professional couple in an expensive metro. Replacing it with portfolio yield is a large problem, and the size of the required capital depends almost entirely on which yield tier you accept.
The Conservative Tier: 3% to 4% Yield
This is the world of broad-market dividend ETFs, dividend growth strategies, and blue-chip equity income funds. A portfolio like Vanguard High Dividend Yield ETF (NYSEARCA:VYM) sits here, anchored by holdings such as Broadcom (NASDAQ:AVGO | AVGO Price Prediction) at roughly 8% of assets, JPMorgan Chase (NYSE:JPM) at 3%, and Exxon Mobil (NYSE:XOM) at 3%. Schwab’s dividend equity fund and iShares’ core dividend growth product live in the same neighborhood.
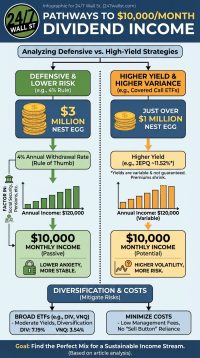
The math: $360,000 divided by 0.035 equals about $10.3 million. At 4%, $360,000 divided by 0.04 equals $9 million. You give up nothing in diversification, and dividend growth of 6% to 8% a year can meaningfully lift income over a decade. You give up capital efficiency. If you don’t have $9 million, this tier is aspirational.
The Moderate Tier: 5% to 7% Yield
Covered call equity income funds, preferred share ETFs, mortgage-light REIT funds, and high-yield corporate bond funds populate this range. The 30-year Treasury at roughly 5.2% is itself a moderate-tier instrument at the safest end. Layer in preferreds and investment-grade high-yield credit, and blended yields in the 5% to 7% range are realistic today.
The math: $360,000 divided by 0.06 equals $6 million. At 7%, the requirement drops to roughly $5.1 million. You save several million in capital. You give up growth. Covered call strategies cap upside during rallies, preferreds behave like long bonds when rates move, and REITs are sensitive to the 10-year Treasury yield, currently near 4.7% and close to a 12-month high. Income is stable in nominal terms; keeping pace with inflation is not guaranteed.
The Aggressive Tier: 8% to 14% Yield
Business development companies, mortgage REITs, leveraged closed-end funds, and single-stock or index-based options-income ETFs push yields into double digits. At 10%, $360,000 divided by 0.10 equals $3.6 million. At 12%, $3 million funds the goal.
The tradeoff is real. Many of these vehicles return capital as part of the distribution, meaning the principal shrinks while the check keeps coming. BDCs cut payouts during credit cycles. Mortgage REITs are exposed to rate volatility, and the 10Y-2Y spread near half a point tells you the curve is normal but not generous. High current income here often means lower total return over 20 years.
The Growth Trap Most Investors Miss
A 3.5% yield that grows 8% a year doubles the income stream in roughly nine years. A 12% yield with flat or declining distributions produces $360,000 today and, plausibly, $280,000 in a decade after distribution cuts and NAV erosion. With Core PCE near the top of its 12-month range, the inflation drag on flat income is not theoretical. Lower headline yield often wins the 20-year race.
What to Do Next
- Separate spending from income. If your actual annual spending is $240,000 rather than $360,000, you may need $6 million at 4% instead of $9 million. Build the target off spending, not gross salary.
- Compare 10-year total return, not headline yield. Pull the total return of a 3.5% dividend growth fund and a 10% options-income fund over the last decade. The gap will reframe the tradeoff.
- Model taxes at $360,000. Qualified dividends and long-term capital gains are taxed differently than BDC and REIT distributions, most of which are ordinary income. In a high-tax state, the after-tax yield gap between tiers narrows meaningfully.
Contact [email protected] for any questions or corrections.
I am a long time investor and student of business, and believe finding good companies that can become great investments is the best game on earth. After 20 years of writing and researching the public markets it is clear that individuals have never had more tools and information to take control of their financial lives. From ETFs and $0 commissions to cryptos and prediction markets there has never been a greater democratization of access to investing.
I write to help people understand the investments available to them so they can make the best choice for their portfolio, whether they're starting out or looking for income in retirement.