How to Build $7,200 a Month in Dividend Income Without Selling a Single Share
Generating $86,400 a year in dividends sounds like a number reserved for the ultra-wealthy, but the capital required swings dramatically depending on one variable most investors overlook before they build a single position.


$7,200 a month in distributions works out to $86,400 a year. That is roughly what a comfortable retirement costs in most of the country once a paid-off house and Medicare are in the picture. The real question is how much capital you need to park, and what you have to accept in exchange, to produce it without ever selling a share.
The core math stays constant at every stop: income target divided by yield equals capital required. With the 10-year Treasury now sitting near 5.2%, its highest level since 2007, every dividend strategy below faces a stiffer test against that risk-free benchmark. The Federal Reserve restarted its rate-hiking cycle in September 2026, which only sharpens the comparison.
The Conservative Tier: 3% to 4% Yield
This is where dividend growth ETFs and blue-chip payers live. At a 3.5% yield, $86,400 divided by 0.035 equals roughly $2,468,571 in capital. At 4%, the required capital drops to $2,160,000.
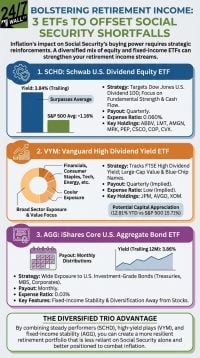
Schwab U.S. Dividend Equity ETF (NYSEARCA:SCHD) anchors this tier. The fund paid $1.05 in trailing 12-month distributions against a recent price near $33, placing its yield at about 3.2%. Total return has been the real story: SCHD delivered roughly 27% over the past year and is up about 24% year-to-date in 2026. Top holdings include QUALCOMM at roughly 6.7%, Texas Instruments at about 5.9%, and UnitedHealth Group at about 5.1%, a diversified base of durable dividend payers.
Amgen (NASDAQ:AMGN | AMGN Price Prediction) plays a similar role for individual-stock buyers. The biotech yields about 2.4% on a $10.08 annual dividend, with the quarterly payout holding at $2.52 through all three quarters of 2026. The company raised its full-year 2026 revenue guidance to a range of $38.2 billion to $39.4 billion after Q2 total revenues climbed 10% to $10.1 billion. The stock trades at a forward PE of roughly 17. The yield is modest, but Amgen’s payout has grown steadily for 13 consecutive years.
Tradeoff: this tier demands the most capital. What investors receive in return is diversification, principal that has historically appreciated, and a payout that tends to grow faster than inflation over time.
The Moderate Tier: 5% to 7% Yield
REITs, preferreds, and high-dividend equity funds sit here. At 5%, $86,400 divided by 0.05 equals $1,728,000. At 7%, the figure drops to roughly $1,234,286.
Realty Income (NYSE:O) is the archetype of this tier. The net-lease REIT yields 5.2% on a $3.252 annualized per-share dividend paid monthly, and its record of consistency is hard to match: 115 consecutive quarterly dividend increases as of June 2026. Q2 2026 revenue reached $1.55 billion, up 9.7% year over year, with portfolio occupancy at 98.8%. AFFO coverage remains solid, with 2026 guidance of $4.44 to $4.45 per share against the $3.252 annualized payout, meaning dividends consumed about 74.5% of AFFO in the second quarter. The company also earned an “A” long-term issuer rating from Fitch Ratings in August 2026 and announced a $6 billion hyperscale data center joint venture, signaling a push into new property types.
Tradeoff: dividend growth slows at this yield level, and the share price has been rangebound over a five-year stretch. Monthly cash flow arrives reliably. Capital appreciation does not.
The Aggressive Tier: 8% to 12% Yield
Covered-call ETFs, business development companies, and mortgage REITs cluster here. At 10%, $86,400 divided by 0.10 equals $864,000. At 12%, the capital requirement falls to $720,000.
The risk is worth naming plainly: principal erosion is common in this tier. Distributions can be cut when credit cycles turn or option premiums compress. Many funds pay out capital as much as earned income. With the 10-year Treasury now at 5.2%, the all-in case for taking on this level of credit and structural risk has narrowed considerably. You are, in effect, spending down the asset while collecting a large check, and a meaningful risk-free alternative now competes for the same dollars.
Why Lower Yields Often Win
A 3.5% yield growing at 8% a year doubles income in about nine years. A 12% yield with zero growth stays flat, and after core PCE inflation, real purchasing power declines every year. Amgen’s payout has climbed from an $8.52 annual run rate in 2023 to $10.08 today. That kind of compounding trajectory beats any static high-yield product over a 20-year retirement, and it does so without requiring a bet on the credit market or the options market holding up.
The rising Treasury yield adds a newer wrinkle. At 5.2%, short-dated Treasuries and money-market funds are absorbing capital that might previously have flowed into the aggressive tier. That means lower-yielding but growing dividend payers face less crowding from yield-chasing flows, which can support their valuations as the rate cycle runs.
Three Things to Do This Week
- Price your actual spending. Most people target their gross salary. The number that matters is what leaves your checking account after taxes and payroll deductions. It is usually meaningfully smaller, which reduces the capital target needed to retire on dividends alone.
- Model dividend coverage before yield. Realty Income’s AFFO covers its payout with room to spare. A 12% ETF with distributions running above its net investment income offers no such comfort.
- Blend the tiers. A portfolio weighted toward SCHD and Amgen for growth, with Realty Income providing monthly cash flow, can produce a blended yield near 4% while preserving the compounding that keeps $7,200 a month worth $7,200 in ten years.
Editor’s note: This update refreshes the 10-year Treasury yield to its current level of approximately 5.2% (a 19-year high as of September 2026) and adds context around the Federal Reserve’s September 2026 rate hike; SCHD’s trailing distributions, yield, one-year return, and top-holding weights have been corrected to current figures; Amgen’s revenue figure and forward PE reflect the company’s Q2 2026 earnings release and raised full-year guidance; and Realty Income’s August 2026 Fitch “A” rating and $6 billion data center joint venture announcement have been incorporated.
Contact [email protected] for any questions or corrections.
I am a long time investor and student of business, and believe finding good companies that can become great investments is the best game on earth. After 20 years of writing and researching the public markets it is clear that individuals have never had more tools and information to take control of their financial lives. From ETFs and $0 commissions to cryptos and prediction markets there has never been a greater democratization of access to investing.
I write to help people understand the investments available to them so they can make the best choice for their portfolio, whether they're starting out or looking for income in retirement.