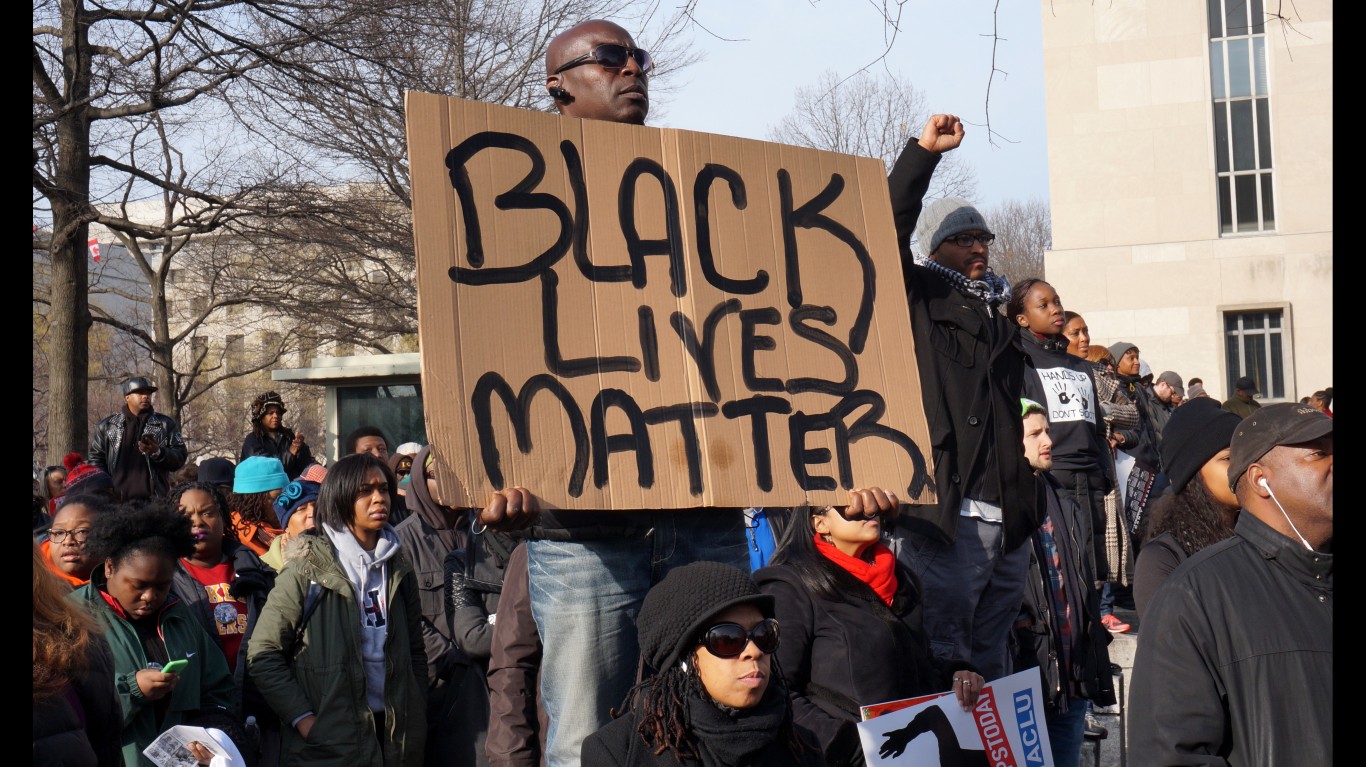
Racial disparities in social and economic outcomes exist in all parts of the United States. Black Americans make about 62 cents for every dollar earned by white Americans. Black Americans are also twice as likely to be unemployed and considerably more likely to live in poverty.
In some places, these disparities are even more pronounced. In many of the worst states for black Americans, there are opportunities to get a good job, earn good pay, and buy a home in a good community. However, these opportunities are not uniformly accessible across racial lines. Based on an examination of a number of socio-economic measures, 24/7 Wall St. identified the worst states for black Americans.
Click here to see the worst states for black Americans
According to Dr. Valerie Wilson, Program Director on Race and Ethnicity in the Economy at the Economic Policy Institute, “You’re never going to find a state or city where the outcome for blacks are better than for whites.” For centuries, there have been stark differences in the conditions and opportunities black Americans have faced.
The Civil Rights Movement led to hopes that racial inequality would soon end. The movement led to a series of reforms, including the Civil Rights Act of 1964, the Voting Rights Act of 1965, and other legislation, known as the “Great Society.” Over the following 50 years, however, further advances have been modest at best.
[protected-iframe width= “45%” height=”650″ class=”alignleft” id=”d711083f7aa601a6409fb9a39f5fd1ee-5450697-55502028″ info=”//cdn2.lockerdome.com/_js/embed.js” style=”margin: 10px 0; max-width: 550px;”]
According to Dedrick Asante-Muhammad, Senior Director of the Economic Department at the NAACP Financial Freedom Center, “It’s one thing to end segregation, but it’s another thing to talk about billions of dollars of investment.” When the United States invested in a middle class in the 1940s and 1950s, it was in a white middle class, explained Asante-Muhammad. However, the country was “never willing to do that same type of investment to create a middle class that would be inclusive of African Americans.”
The effects of this unwillingness to invest in the black community are clear in the racial economic outcome gaps. According to the Bureau of Labor Statistics, for example, the national jobless rate for November was 5.8% nationwide. Among white Americans, the figure was 4.9%. Among black Americans it was 11.1%.
Segregation also creates different communities with different social services. The quality of schools, property values, the quality of services available, and the quality of food are all “legacies of racially segregated neighborhoods in this country,” said Wilson. Six of the worst states were home to nearly half of the 30 most segregated U.S. cities, according to a University of Michigan Institute for Social Research study on racial segregation in large metropolitan areas.
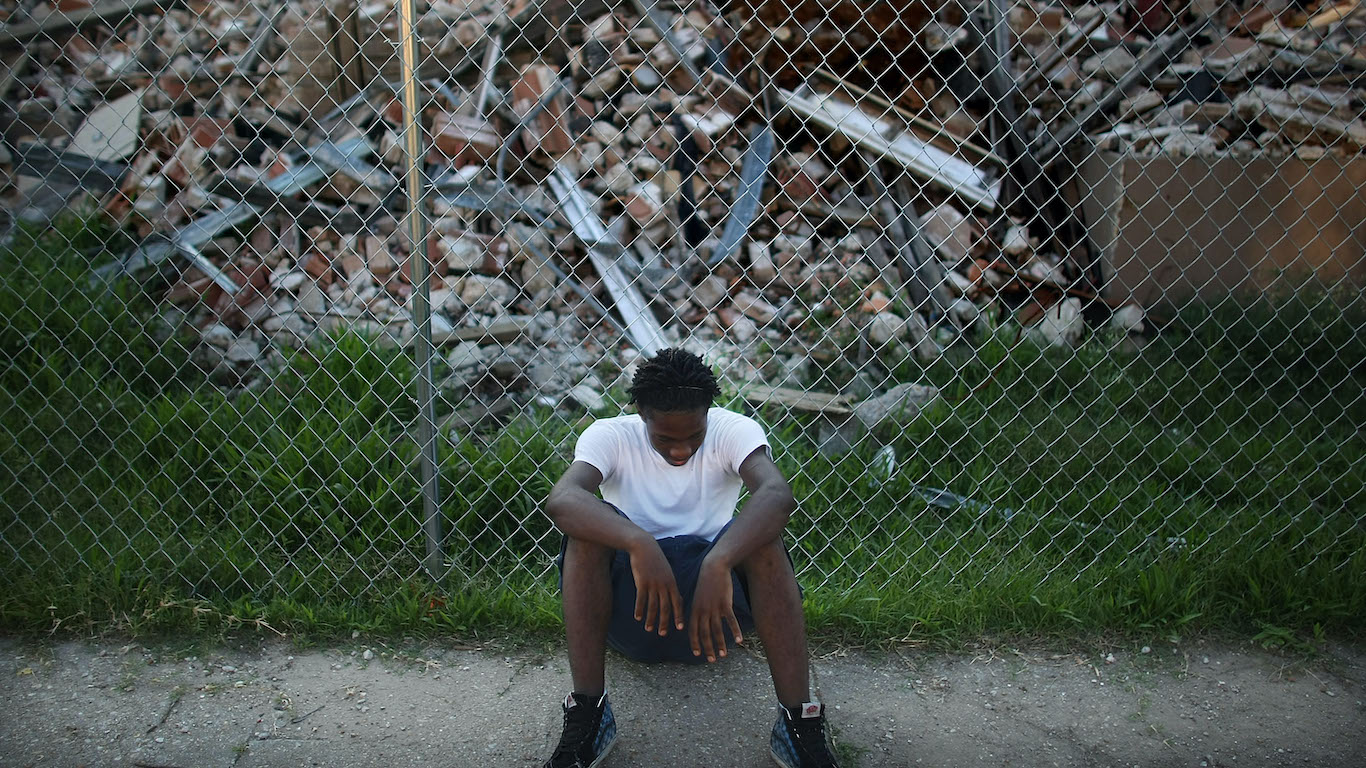
Few factors do more to improve people’s livelihoods than access to good jobs. High employment rates contribute to higher incomes, better health insurance coverage, as well as lower poverty rates. In eight of the worst states for black Americans, the difference between black unemployment rates and that of the whole workforce was higher than the national difference. Black Americans in these states also tended to have higher poverty rates, lower incomes, and lower educational attainment rates than both their white peers and black residents in other states.
The obstacles facing black Americans in the United States begin in early childhood — and they have long-lasting effects. Educational outcomes among African American children in five of the worst states for black Americans were identified by the Annie E. Casey Foundation as worse than the average for African-American children nationwide.
Nationally, less than one in five black adults had attained at least a bachelor’s degree as of last year, versus a rate of nearly one in three among the white population. While the percentage of black adults with at least a bachelor’s degree in some of the states on our list was relatively high, the education gap between black and white state residents was larger than the national gap in nine of the worst states.
Click here to see the worst states for black Americans
Although higher education leads to higher employment and better wages, it “does not eliminate inequality,” said Wilson. The unemployment rate among college-educated black Americans is still about twice that of college-educated white Americans.
Of course, there is no single solution to job inequality. Even highly educated black Americans cannot overcome centuries of segregation and outright discrimination. Both Wilson and Asante-Muhammad pointed out that many people are hired because they know someone, for example. If black Americans are not part of a particular social network, their chances of getting hired at a particular job are smaller. For people who have been historically segregated, four years of elite schooling is not the same thing as “having generation after generation that can connect you to different opportunities through friends and family,” Asante-Muhammad explained.
Inequalities in economic outcomes also persist. A typical black household made just 62.3% of the median income of white households in 2013. Among the worst states, differences in income and poverty were nearly all worse than the national difference. In some states, such as Wisconsin and Minnesota, the median income of black households was roughly half that of white households.
The economic gaps may actually be understated. This is because wealth, which includes assets, such as stocks and real estate holdings, as well as ready access to credit, are not captured by measures of income alone and can often have greater effects on racial inequalities. “Wealth is that which allows you to bridge economic challenges and difficulties,” such as periods of unforeseen expenses or job loss, Asante-Muhammad explained. Wealth is also used to acquire assets like homes and businesses, which are often transferred intergenerationally.
In fact, less than 42% of black households were homeowners, while more than 71% of white households owned a home as of 2013. Differences in rates of homeownership are often far more extreme in the worst states for black Americans. In Minnesota, for example, three out of four white households owned their homes. Meanwhile, only one in four black households in the state owned their home.
Laws can also have a discriminatory effect on black Americans. For example, longer sentences for offenses involving crack cocaine compared to powder cocaine — which are essentially identical — contributed to the disproportionate incarceration rates of black Americans. Wilson explained that crack cocaine was “an epidemic in the African American community.” Because the problem “was more prevalent in those communities, they were disproportionately affected by the sentencing associated with that.” In 2010, the Fair Sentencing Act passed by Congress reduced the sentencing disparity.
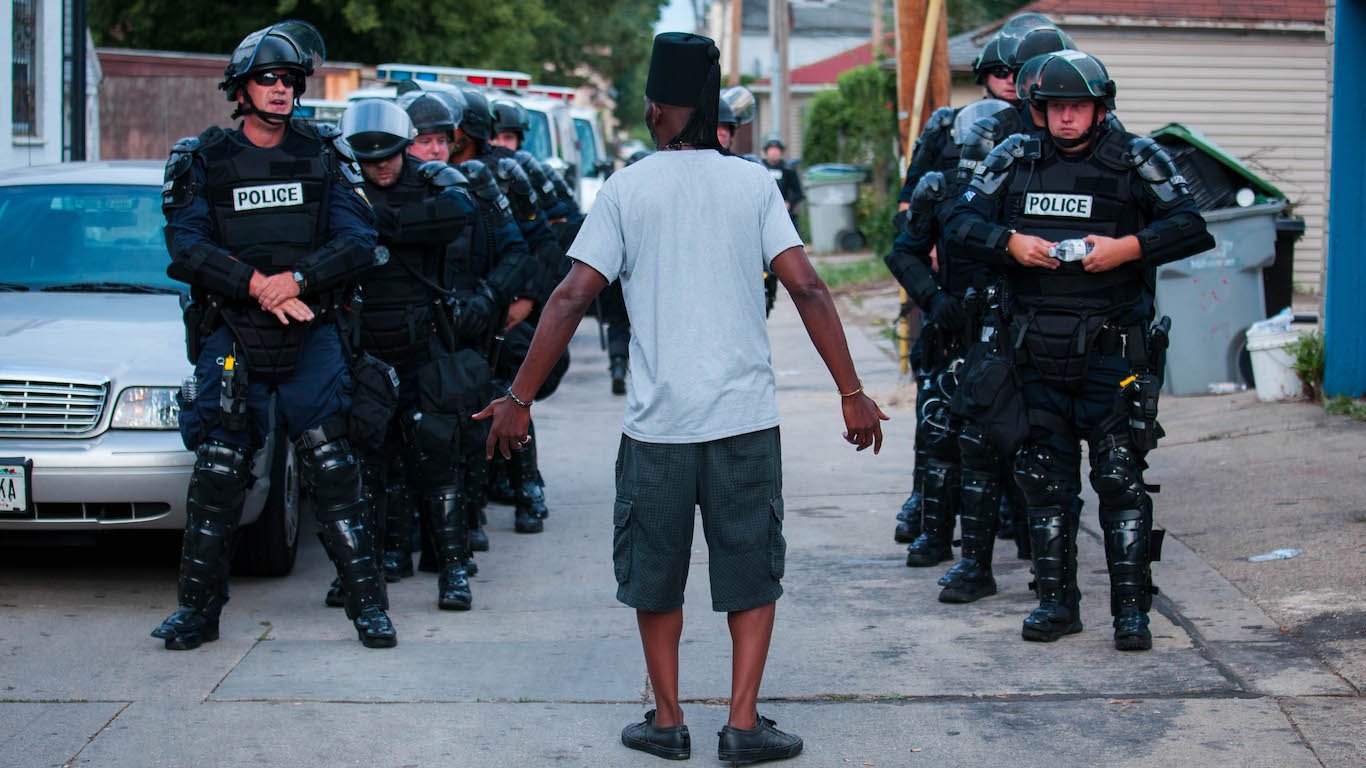
Black Americans were more than five times as likely to go to prison than their white peers as of 2013, and the problem was considerably worse in all 10 states on our list. People with criminal records are more likely to get lower-paying jobs. Further, “When you’re in a community where there is a lack of economic opportunities, people seek alternatives, and unfortunately a lot of those alternatives are criminal,” Wilson said.
While racial inequality is a complicated issue, this does not mean that there are no solutions. “Even if we ended the over-incarceration of African Americans, we’d still have this great racial economic inequality that really will only be dealt with through massive investments, living wage jobs, homeownership opportunities, equal access to education, health care, all of those things, so there is no one solution. It’s not just education, it’s not just health care, it’s a mixture,” Asante-Muhammad said.
These are the worst states for black Americans.
10. Arkansas
> Pct. residents black: 15.7%
> Black homeownership rate: 42.8% (15th highest)
> Black incarceration rate: 2,432 per 100,000 people (24th highest)
> Black unemployment rate: 16.5% (tied-4th highest)
> Unemployment rate, all people: 7.8% (14th highest)
Arkansas is among the worst states for black Americans. Nearly 16% of Arkansas’ population identifies as black. Yet, the state does not have a single black representative in Congress. In addition to limited representation, black Arkansas residents are disproportionately likely to be unemployed. Last year, the state’s unemployment rate for black workers was 16.5%, versus a 7.8% unemployment rate of the state’s labor force. In general, upward income mobility is more limited for Americans living in the South, according to research from the Equality of Opportunity Project. In Arkansas’ largest urban area, Little Rock, the odds of reaching the top income quintile for a person born in the bottom quintile was just 5.4%, well-below the U.S. rate overall. Economic mobility may be even more difficult for black Americans, who, on average, earn less than 60% the median household income of white Americans.
ALSO READ: The Most Corrupt Countries in the World
9. Kansas
> Pct. residents black: 5.8%
> Black homeownership rate: 36.1% (22nd lowest)
> Black incarceration rate: 3,306 per 100,000 people (9th highest)
> Black unemployment rate: 11.8% (14th lowest)
> Unemployment rate, all people: 5.6% (12th lowest)
A typical black household in Kansas made 60.2% of the median white household income in 2013, slightly wider than the national income gap. Lower incomes among the state’s black population are due in part to the relatively large gaps in educational attainment and incarceration rates compared to white residents, among other measures. Nearly 32% of white state residents had attained at least a bachelor’s degree in 2013, while 18.3% of black residents had done so, a difference of nearly 14 percentage points, larger than the national gap of 11.6 percentage points. While black Americans were 5.12 times more likely to go to prison than their white peers across the U.S., in Kansas, black residents were nearly eight times more likely to go to prison, one of the higher disparities nationwide. As in several other states on this list, Kansas residents are also not represented at all by black congressmen in the U.S. Congress.
8.New Jersey
> Pct. residents black: 13.7%
> Black homeownership rate: 39.1% (23rd highest)
> Black incarceration rate: 1,992 per 100,000 people (13th lowest)
> Black unemployment rate: 13.0% (21st lowest)
> Unemployment rate, all people: 8.2% (7th highest)
Nearly 16% of New Jersey’s black population lived in poverty in 2013. This figure is lower than the national poverty rate of 17.1% and partially reflects the fact that the state is among the wealthiest in the country. Yet, the typical black household made only 58% of the typical white household, a wider income gap than across the county. Only one in five black residents had at least a bachelor’s degree in 2013, much lower than the nearly 40% of white adults who had held at least such a degree. As Wilson explained, without economic opportunity people often turn to alternatives that may be illegal. Blacks were more than nine times as likely to be imprisoned in 2013, nearly twice the national ratio. Homeownership is another issue that many black Americans face. While more than 75% of white households owned their own home in 2013, fewer than 40% of black households did, a much larger disparity than across the U.S.
7.Connecticut
> Pct. residents black: 10.3%
> Black homeownership rate: 35.0% (21st lowest)
> Black incarceration rate: 2,260 per 100,000 people (21st lowest)
> Black unemployment rate: 13.3% (20th highest)
> Unemployment rate, all people: 7.7% (15th highest)
Connecticut is home to a relatively high number of highly segregated metro areas, according to an analysis of 2010 Decennial Census data by Brookings Institution’s demographer William Frey. All three of Connecticut’s metro areas — Bridgeport, Hartford, and New Haven — are also among the 30 most racially-segregated in the country. In addition to living in different neighborhoods, black state residents are far less likely to own their home. The nearly 41 percentage point gap between black and white homeownership rates — 35.0% and 75.8% respectively — was among the worst in the nation. Similarly, the state had among the worst gaps in other key measures of social outcomes. Just 19.2% of black residents had at least a bachelor’s degree, versus 39.7% of the state’s white 25 and older population. Further, Connecticut had one of the largest disparities in incarceration rates in the nation, with black residents 9.38 times more likely than whites residents to be incarcerated.
6. Michigan
> Pct. residents black: 13.9%
> Black homeownership rate: 42.6% (16th highest)
> Black incarceration rate: 2,169 per 100,000 people (18th lowest)
> Black unemployment rate: 16.5% (tied-4th highest)
> Unemployment rate, all people: 8.6% (6th highest)
For every 100,000 black Michigan residents, more than 965 died last year, a higher rate than in all but a handful of states. The same rate for white state residents was lower by 214, nearly the widest gap by this measure in the country. Poor health and the generally higher death risk among black Michigan residents can be partly explained by economic and social factors. For example, 16.5% of black workers in the state were unemployed last year. A relatively high level of unemployment tends to lower health insurance coverage and exacerbate health risks. The jobless rate for black residents was also nearly 8 percentage points higher than the rate for white Michigan residents, which was one of the wider gaps reviewed. African-American children in Michigan also had among the worst educational outcomes compared to most of the nation. Additionally, Michigan reported 31 racially-motivated hate crimes per 100,000 people — many of which likely targeted black residents — the second-highest rate in the nation last year. While Detroit represents a small percent of Michigan’s total population, it was identified as nearly the most racially-segregated city in the United States.
ALSO READ: The Best and Worst Run States in America: A Survey of All 50
5. Pennsylvania
> Pct. residents black: 11.0%
> Black homeownership rate: 43.1% (14th highest)
> Black incarceration rate: 3,269 per 100,000 people (10th highest)
> Black unemployment rate: 14.4% (15th highest)
> Unemployment rate, all people: 7.5% (20th highest)
While some 28% of Pennsylvania’s black population did not have health insurance last year, only 8.5% of the white population did not, a difference of 20 percentage points. Also, as in the majority of the states on this list, African-American children faced larger obstacles to opportunities than their white classmates — much more than black children faced nationwide. Geographical segregation may partly explain the discrepancy in educational outcomes. A number of Pennsylvania cities, including Philadelphia, Pittsburgh, and Harrisburg, were identified in a recent analysis by the University of Michigan’s Institute for Social Research as among the nation’s 20 most racially-segregated cities. In addition, black state residents were nearly nine times more likely than their white peers to go to prison, a larger incarceration rate gap than the vast majority of states.
4.Illinois
> Pct. residents black: 14.2%
> Black homeownership rate: 38.5% (25th highest)
> Black incarceration rate: 2,128 per 100,000 people (17th lowest)
> Black unemployment rate: 17.0% (3rd highest)
> Unemployment rate, all people: 9.1% (3rd highest)
Social and health outcomes for Illinois’ black residents are far worse than for white residents. As of 2013, 17% of black workers were unemployed, versus 9.1% of the state’s workforce. Also, the incarceration rate for black Americans in the state, at 2,128 per 100,000 people, was more than eight times that for white residents. Tragically, Illinois had one of the largest gaps in death rates between white and black Americans. As of 2012, the death rate for white residents was 711.8 per 100,000 people, far better than the 925.6 deaths per 100,000 black residents. According to data from the University of Michigan’s Institute for Social Research, as of 2010, Chicago was among the most segregated metro areas in the nation, despite considerable improvements in the past 20 years.
ALSO READ: The 10 Best Cities for Waiters
3. Rhode Island
> Pct. residents black: 6.4%
> Black homeownership rate: 29.4% (10th lowest)
> Black incarceration rate: 1,884 per 100,000 people (11th lowest)
> Black unemployment rate: 16.0% (6th highest)
> Unemployment rate, all people: 9.2% (2nd highest)
While typical black households earned 62.3% of the white median household income across the nation, black Rhode Island households made just 52.5% of white households in the state. Such disadvantage can lead to a variety of negative outcomes, including higher poverty and death rates. Last year, there were 234 more deaths per 100,000 people among the black population in Rhode Island than among the white population, nearly the largest gap nationwide. More than 23% of black Rhode Islanders lived in poverty last year, while less than 11% of white residents lived in poverty, a difference of than 12 percentage points, among the larger gaps nationwide. Another particularly detrimental area of inequality is the housing market. While 67.2% of white households in the state were homeowners, only 29.4% of black households were. The 38 percentage points was wider than the gap nationwide of nearly 30 percentage points.
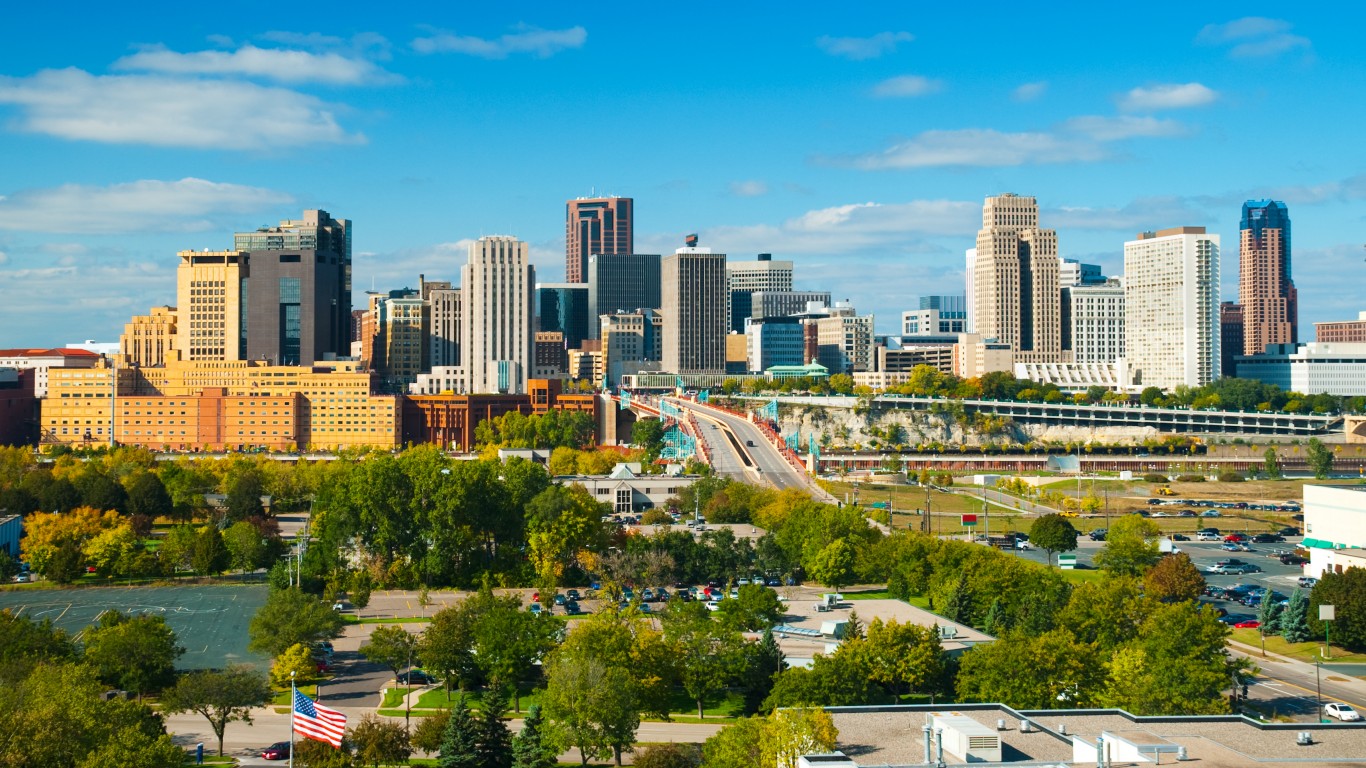
2. Minnesota
> Pct. residents black: 5.4%
> Black homeownership rate: 25.7% (5th lowest)
> Black incarceration rate: 2,321 per 100,000 people (22nd lowest)
> Black unemployment rate: 15.0% (tied-11th lowest)
> Unemployment rate, all people: 4.9% (9th lowest)
A typical black household in Minnesota earned less than half the median income of white households in 2013, well below the 62.3% nationwide. Low incomes among the black population are likely due in part to a high unemployment rate. While 15% of black workers in the state were unemployed in 2013, fewer than 5% of the total workforce did not have a job, a gap nearly twice as large as the national gap. High unemployment rates tend to lead to higher rates of people without health insurance, as a majority of Americans receive health insurance through their employers. While only 6.9% of white residents did not have health insurance in 2013, nearly 33% of blacks were uninsured. Additionally, black Minnesotan households were three times less likely than white households to own their homes, a rate nearly twice as high as the rest of the nation. Across the country, black Americans were also more likely to be disenfranchised as a result of the criminal justice system. In 2013, more than 7% of Minnesota’s black population was barred from voting as a result of felony convictions or imprisonment.
ALSO READ: The 10 Worst Countries for Women
1. Wisconsin
> Pct. residents black: 6.2%
> Black homeownership rate: 28.1% (7th lowest)
> Black incarceration rate: 4,042 per 100,000 people (3rd highest)
> Black unemployment rate: 15.0% (tied-11th highest)
> Unemployment rate, all people: 6.7% (21st lowest)
Based on our index, Wisconsin is the worst state for black Americans. Typical black Wisconsin households made roughly half the white median household income, a wider income gap than in the majority of states. Wisconsin’s black residents were also far less likely than white residents to have health insurance, with a gap of more than 30 percentage points. Black Americans in Wisconsin are at a much greater risk of death than their white peers as well, which could be due in part to poor health coverage. There were 980 deaths per 100,000 people among Wisconsin’s black population — one of the highest rates nationwide. This figure represents 288 more deaths than the comparable rate for white residents, nearly the largest gap reviewed. Black Wisconsin residents were also nearly 10 times more likely than white residents to go to prison, nearly the largest gap. Black children in Wisconsin had worse educational outcomes than both their white classmates and their black peers in other states. Milwaukee led the nation of most racially-segregated U.S. cities, which may actually make the problem in Wisconsin more a problem for Milwaukee, where the vast majority of the state’s black population lives.
Methodology
To determine the 10 worst states for black Americans, 24/7 Wall St. created an index of 12 measures from a variety of data sources. The index was designed to assess race-based gaps in access to resources and opportunities in each state, rather than measure the availability of resources and opportunities in those states. Creating the index in this way ensured that states were ranked based on differences between black and white Americans and not levels of socioeconomic development. We ranked the size of the race gap for each measure, with the largest gap receiving the worst score. We excluded states where black residents comprised less than 5% of the population.
To construct the index, we considered data from the U.S. Census Bureau on median household income, poverty rates, educational attainment rates, homeownership rates, and the percentage of people without health insurance. Unemployment figures came from the Bureau of Labor Statistics. Data on incarceration rates and disenfranchisement came from the The Sentencing Project and are for the most recent available year. We also considered age-adjusted death rates and infant mortality rates per 100,000 people from the Centers for Disease Control and Prevention.
Additionally, we considered an analysis of racially-segregated metropolitan areas authored by William Frey of the Brookings Institution in partnership with the University of Michigan’s Institute for Social Research. Educational outcomes for African-American children came from the Annie E. Casey Foundation’s 2014 report, Race for Results: building a path to opportunity for all children.
Contact [email protected] for any questions or corrections.