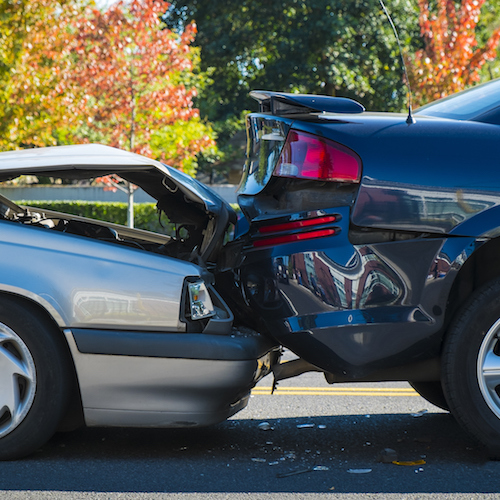
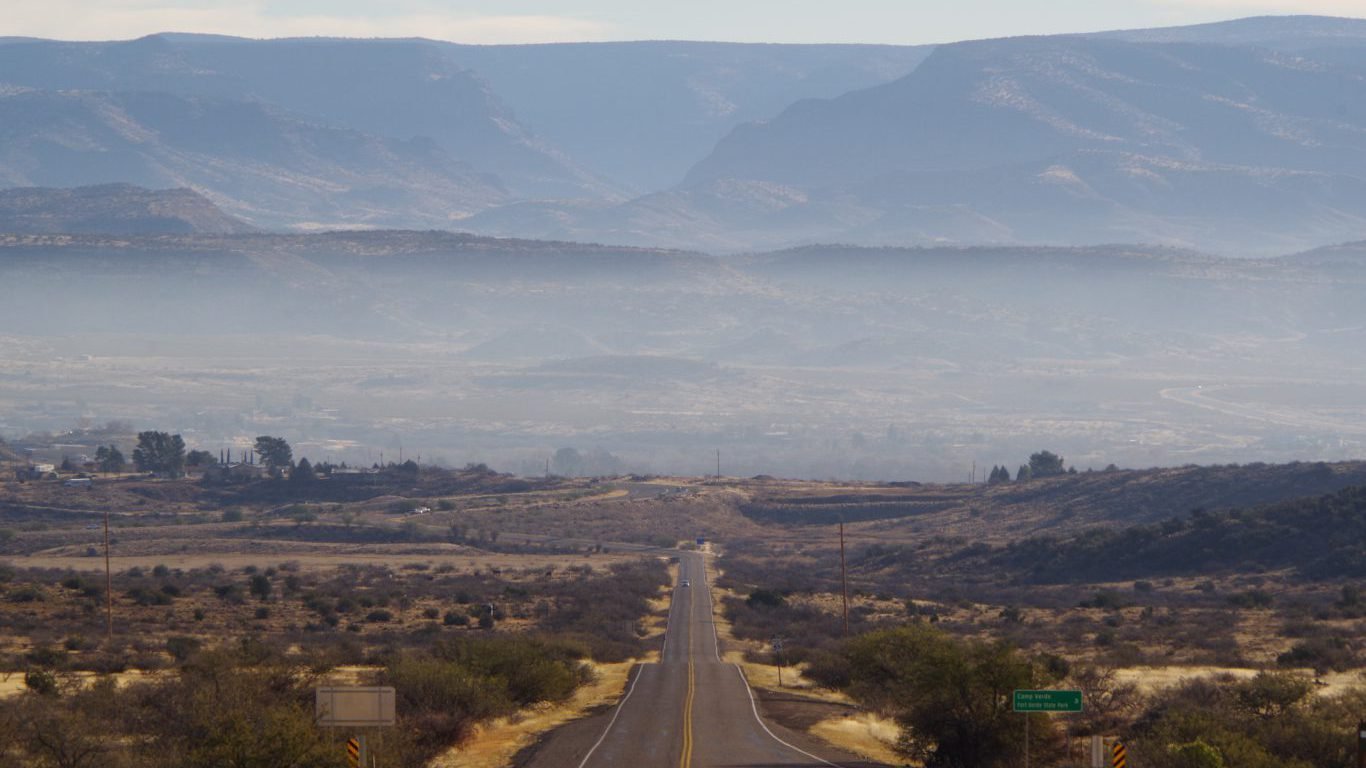
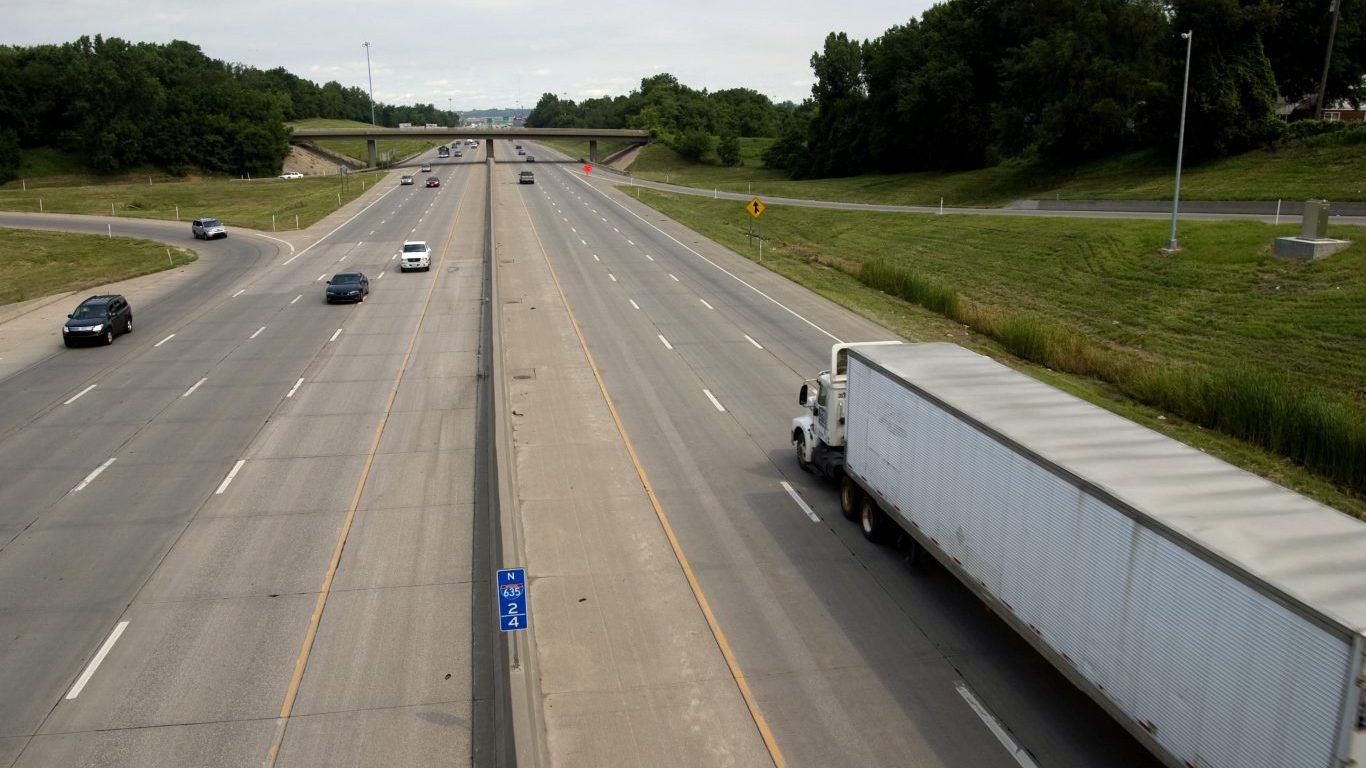
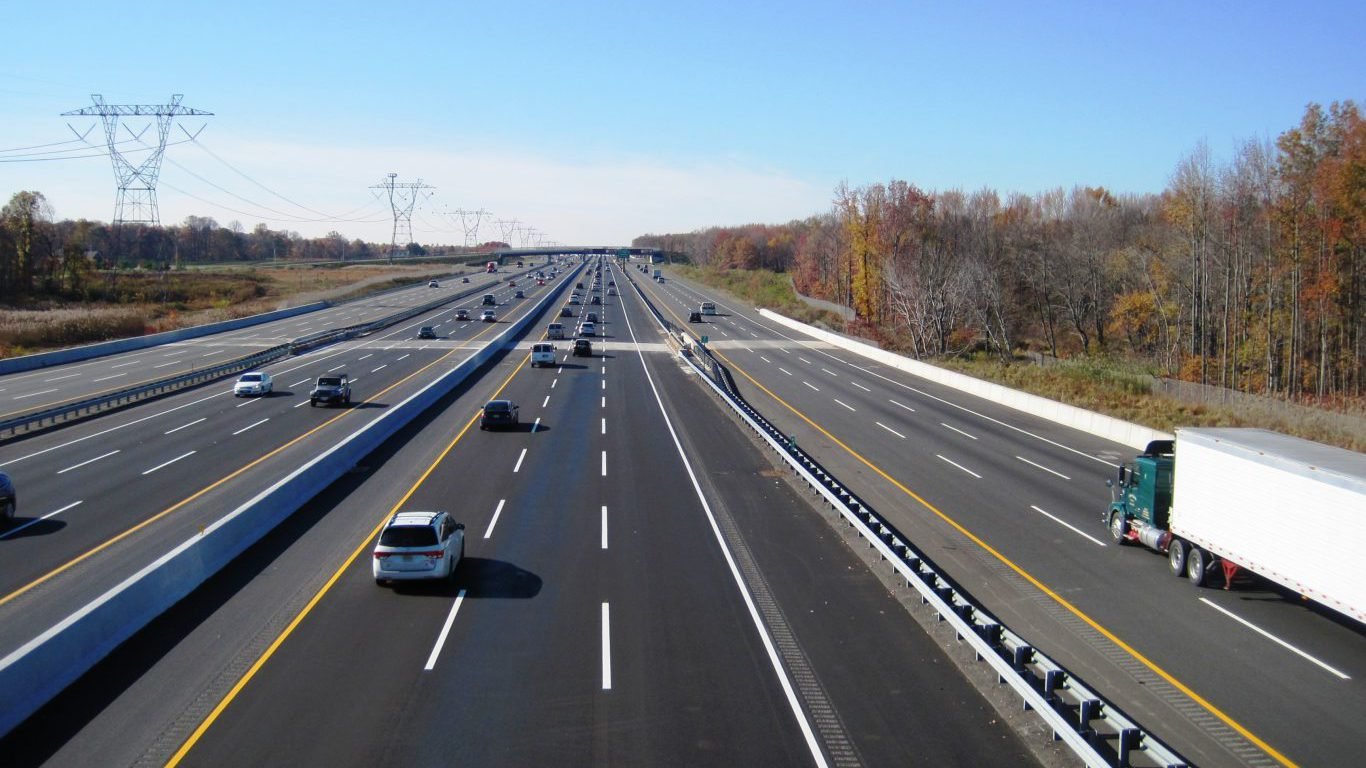
Americans 65 years of age and older are 21% more likely to be killed in a traffic accident than the population as a whole. While people of this age group account for 14.5% of the total population, they represent 17.5% of all traffic fatalities.
The difference between the likelihood of traffic fatalities among older Americans and the entire population varies between states. To determine where driving is the most dangerous for seniors, 24/7 Wall St. compared traffic fatality data for state residents 65 years and older to that of the state’s entire population. The states with the widest gaps in fatality rates between these age groups were considered the most dangerous states to drive for seniors.
The most dangerous state for older Americans is Rhode Island, where seniors are 2.2 times more likely to die in a traffic accident than the overall state population. By contrast, seniors in New Mexico are 38% less likely than the state’s total population to die in a traffic accident, the safest state for seniors in the nation.
Click here to see the most (and least) dangerous states for older drivers.
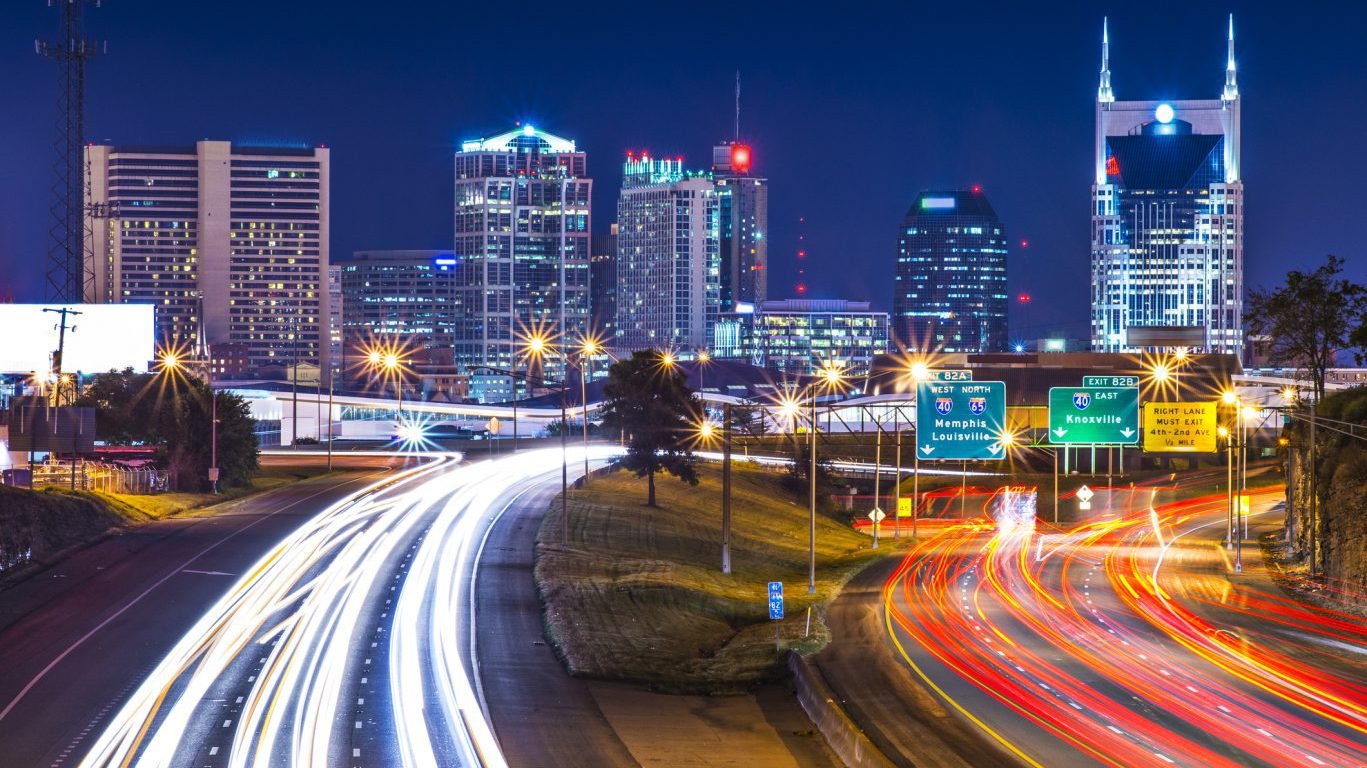
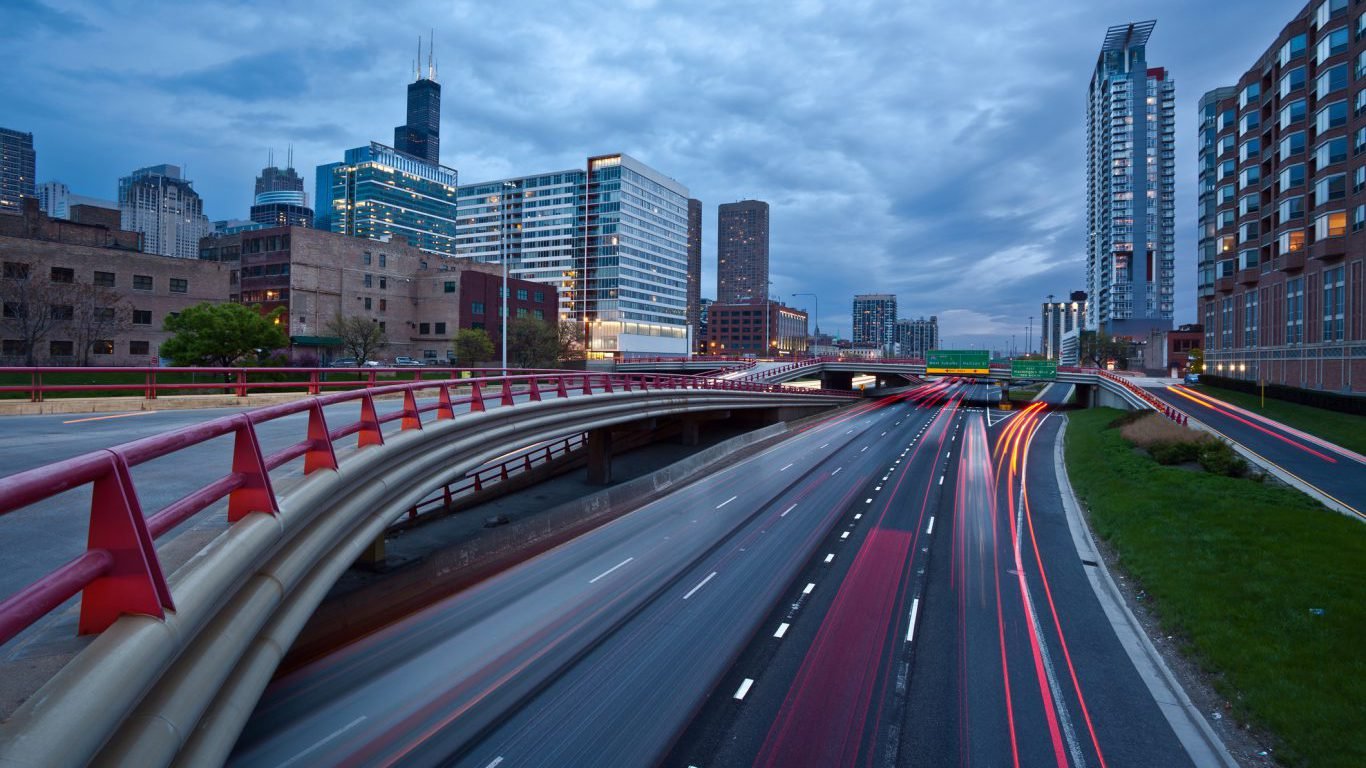
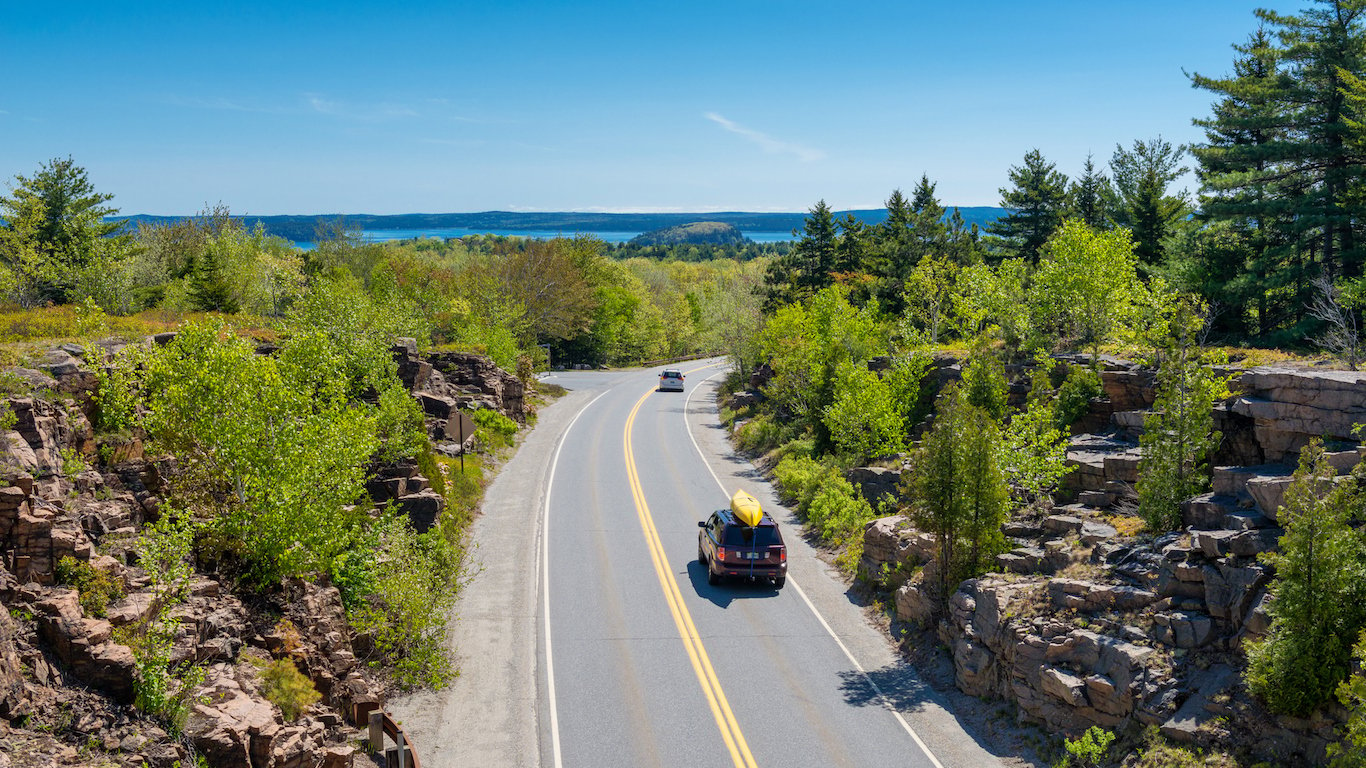
States with the highest overall rates of traffic fatalities — including drivers, passengers, cyclists, and pedestrians — are not necessarily the states that are the most dangerous for senior drivers. Instead, the most dangerous states for Americans 65 and older are states with the highest share of residents 85 and older.
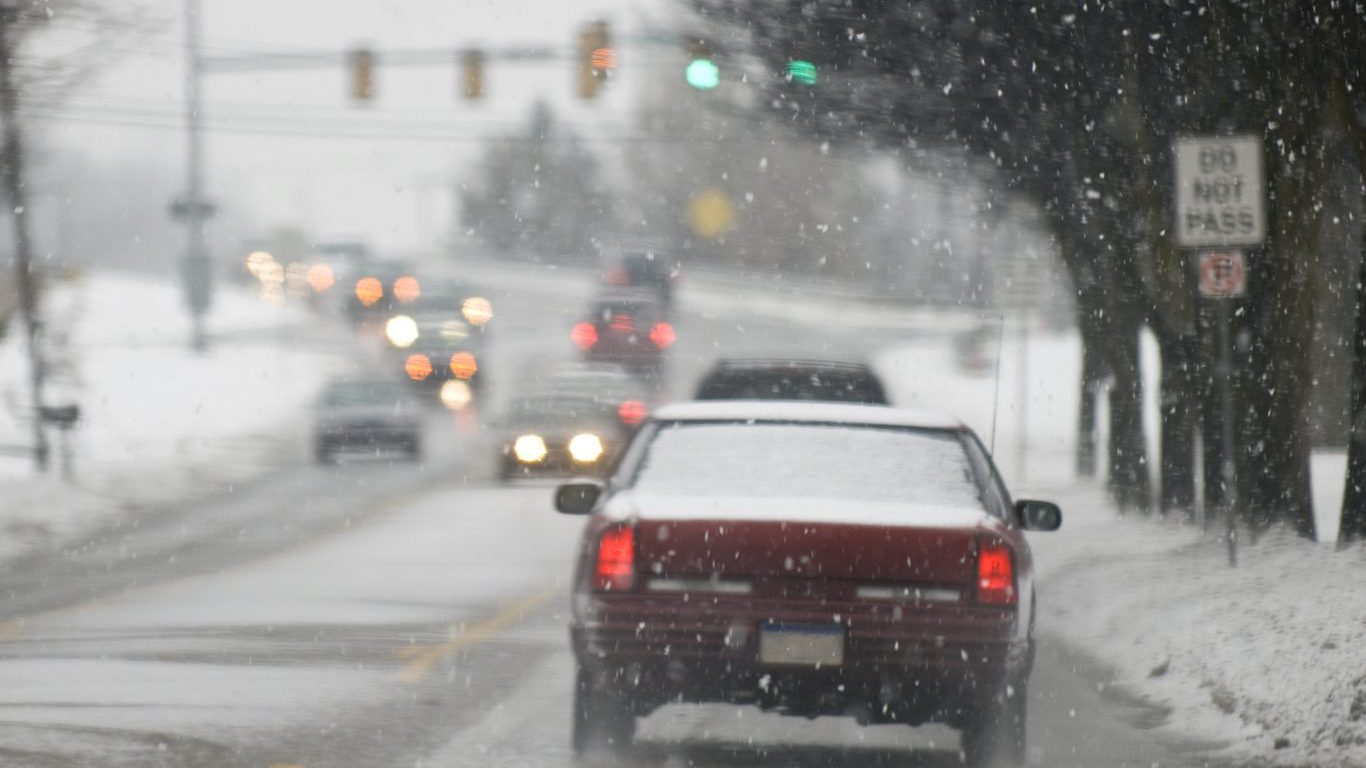
Age-related vision and cognitive declines, which worsen with age, can impair driving capabilities. However, this is not the main contributor to seniors having a higher traffic fatality rate than younger individuals.
The main contributor is the susceptibility of seniors to injury and medical complications when involved in an accident. Drivers who are 80-84 year olds, for example, tend to be involved in the same number of accidents as 25-29 year olds. Yet, the 80-84 year old drivers are nearly three times as likely to die from those accidents.
Because the risk of dying from an accident increases as a senior ages, the share of 85 and older residents is one predictor of a state’s elderly car accident death rate. Rhode Island, for example, where elderly residents are more than twice as likely as the whole population to die in a car accident, is tied for the largest share of residents 85 and older in the nation. In Alaska, on the other hand, seniors are considerably less likely to die in a traffic accident than the total population. This may be partially due to the fact that only 0.8% of Alaska’s population is 85 and older, the lowest share of any state.
To identify the states where driving is the most dangerous for seniors, 24/7 Wall St. compared traffic fatality rates for residents 65 and older and for the entire state population. Data for these rates are from the National Highway Traffic Safety Administration and are as of 2014, the most current available. Populations by age are from the 2014 American Consumer Survey from the U.S. Census Bureau.
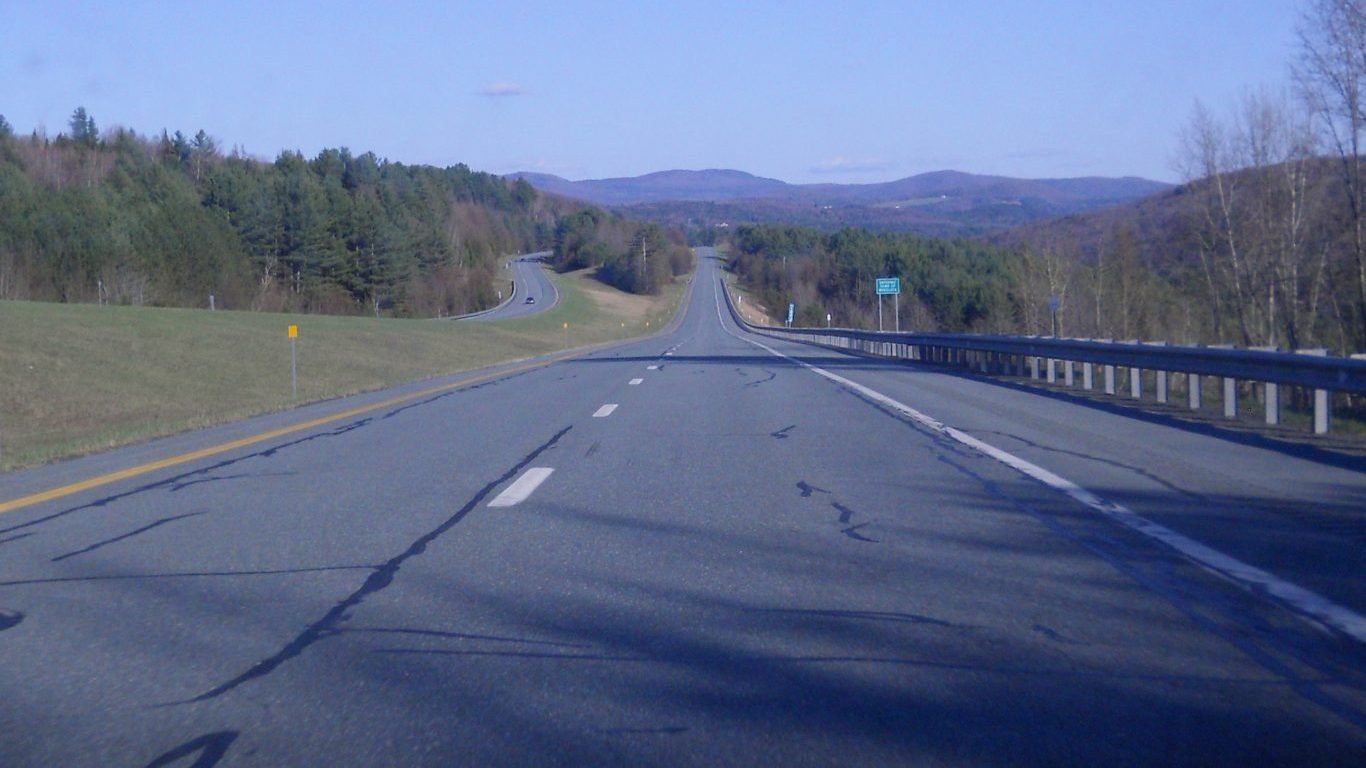
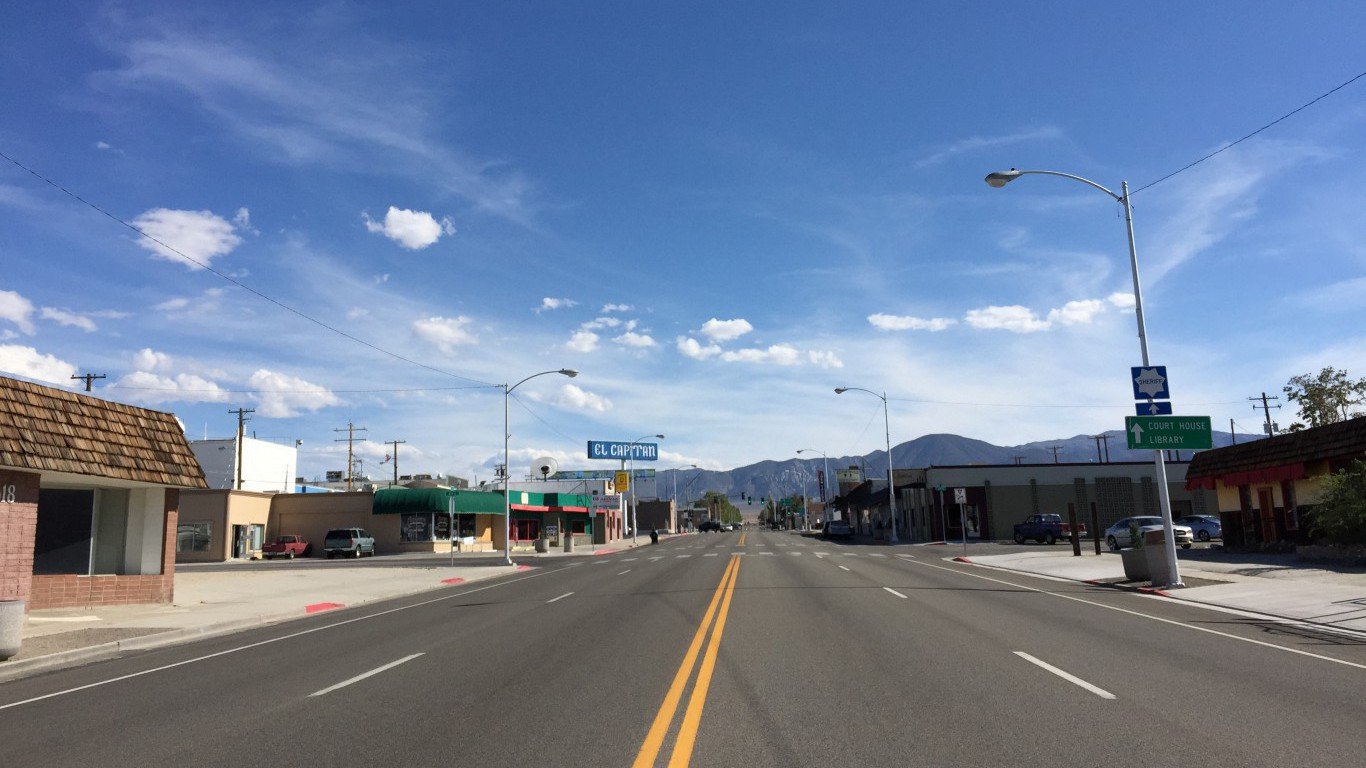
These are the most dangerous states to drive for seniors.
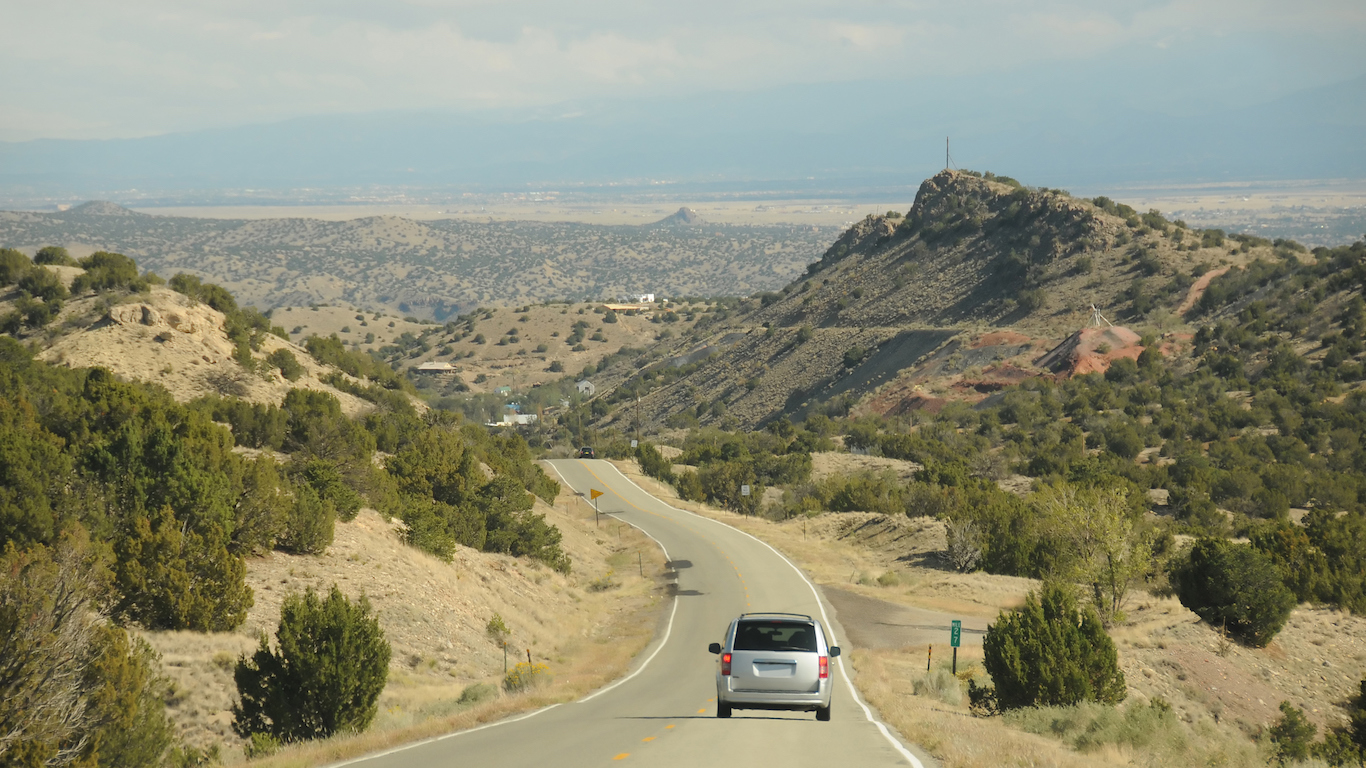
50. New Mexico
> Traffic fatality risk for elderly vs. total pop.: 38.4% less likely
> Traffic fatalities, 65 and older: 11.3 per 100,000 (20th lowest)
> Traffic fatalities, total pop.: 18.4 per 100,000 (4th highest)
> Pct. pop. 85 and older: 1.6% (tied-11th lowest)
49. North Dakota
> Traffic fatality risk for elderly vs. total pop.: 32.0% less likely
> Traffic fatalities, 65 and older: 12.4 per 100,000 (23rd lowest)
> Traffic fatalities, total pop.: 18.3 per 100,000 (5th highest)
> Pct. pop. 85 and older: 2.3% (9th highest)
[nativounit]
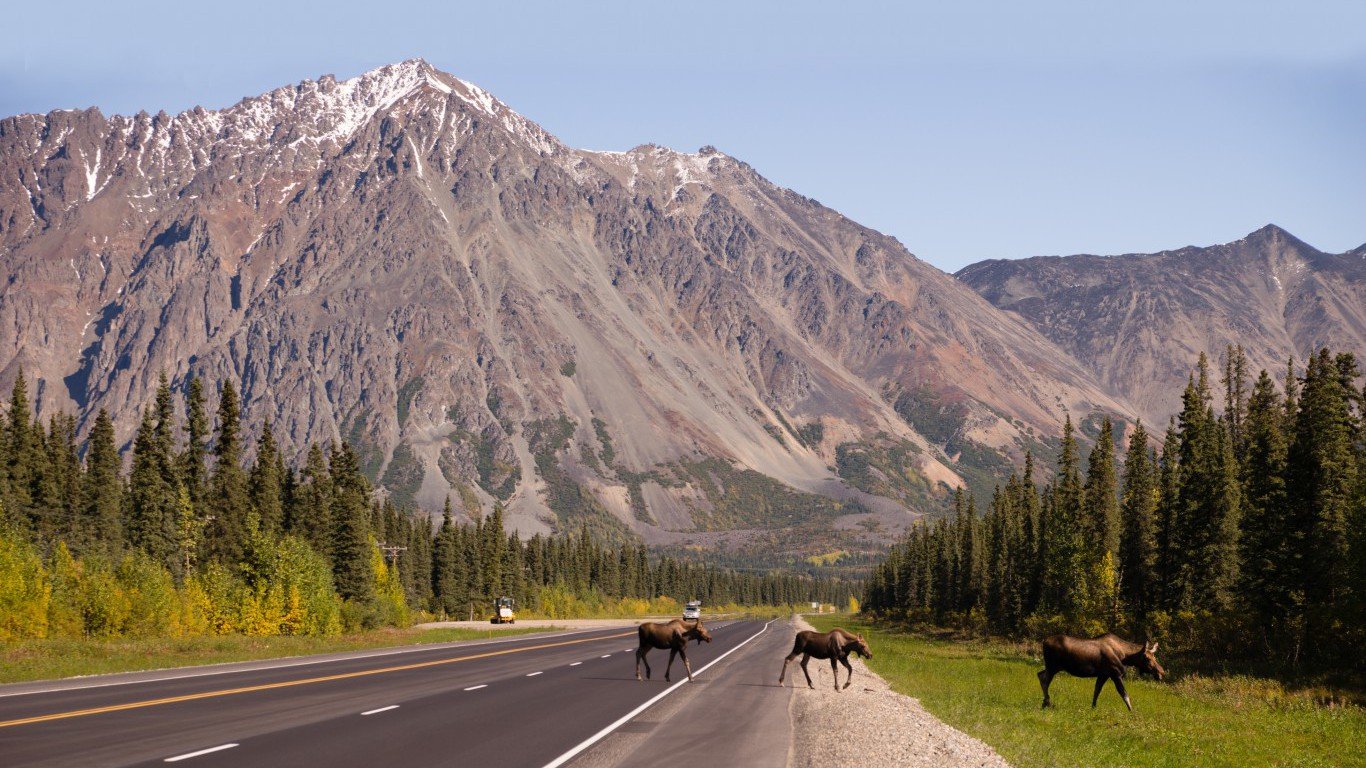
48. Alaska
> Traffic fatality risk for elderly vs. total pop.: 27.8% less likely
> Traffic fatalities, 65 and older: 7.2 per 100,000 (2nd lowest)
> Traffic fatalities, total pop.: 9.9 per 100,000 (23rd lowest)
> Pct. pop. 85 and older: 0.8% (the lowest)

47. Louisiana
> Traffic fatality risk for elderly vs. total pop.: 20.0% less likely
> Traffic fatalities, 65 and older: 12.7 per 100,000 (25th lowest)
> Traffic fatalities, total pop.: 15.9 per 100,000 (10th highest)
> Pct. pop. 85 and older: 1.6% (tied-11th lowest)
[recirclink id=343906]
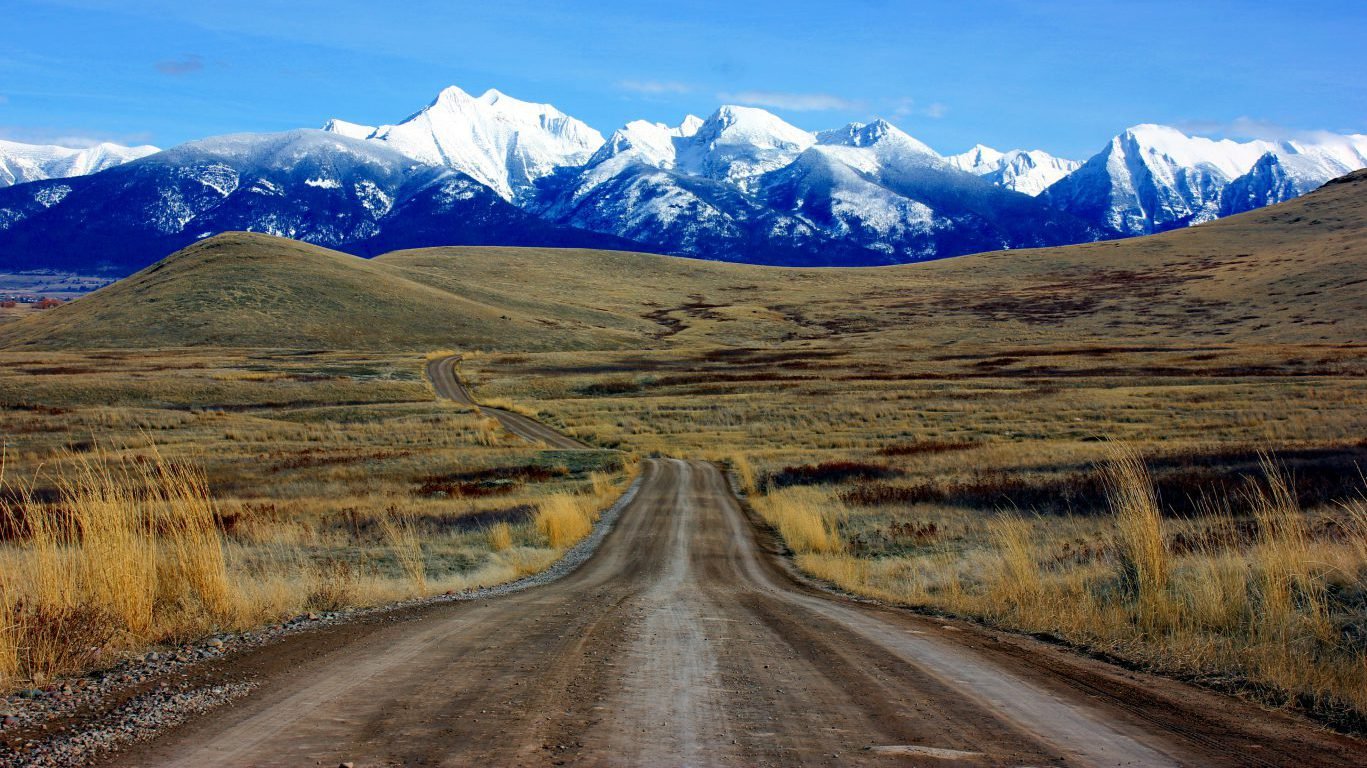
46. Montana
> Traffic fatality risk for elderly vs. total pop.: 9.1% less likely
> Traffic fatalities, 65 and older: 17.0 per 100,000 (10th highest)
> Traffic fatalities, total pop.: 18.8 per 100,000 (3rd highest)
> Pct. pop. 85 and older: 2.0% (tied-23rd highest)

45. Mississippi
> Traffic fatality risk for elderly vs. total pop.: 8.8% less likely
> Traffic fatalities, 65 and older: 18.5 per 100,000 (5th highest)
> Traffic fatalities, total pop.: 20.3 per 100,000 (2nd highest)
> Pct. pop. 85 and older: 1.7% (tied-18th lowest)
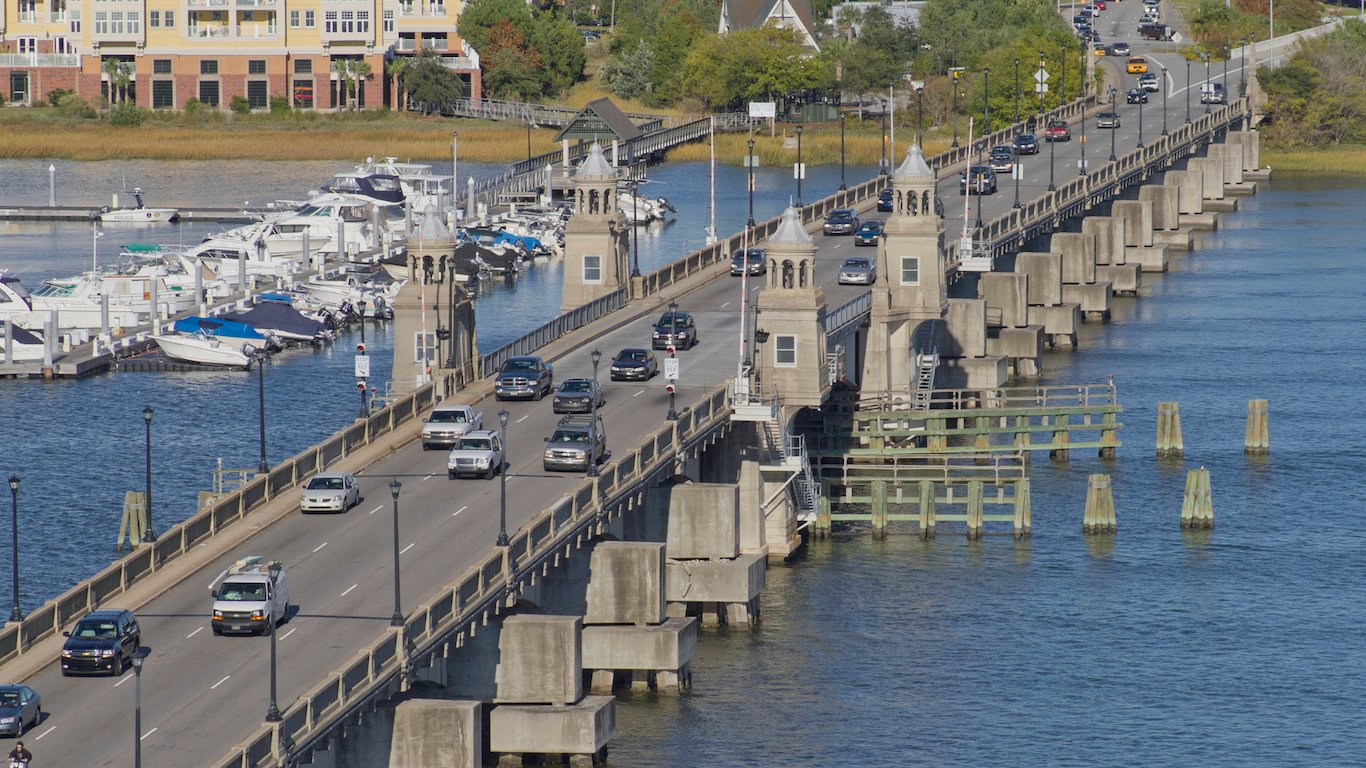
44. South Carolina
> Traffic fatality risk for elderly vs. total pop.: 2.2% less likely
> Traffic fatalities, 65 and older: 16.7 per 100,000 (13th highest)
> Traffic fatalities, total pop.: 17.1 per 100,000 (7th highest)
> Pct. pop. 85 and older: 1.7% (tied-18th lowest)
[nativounit]
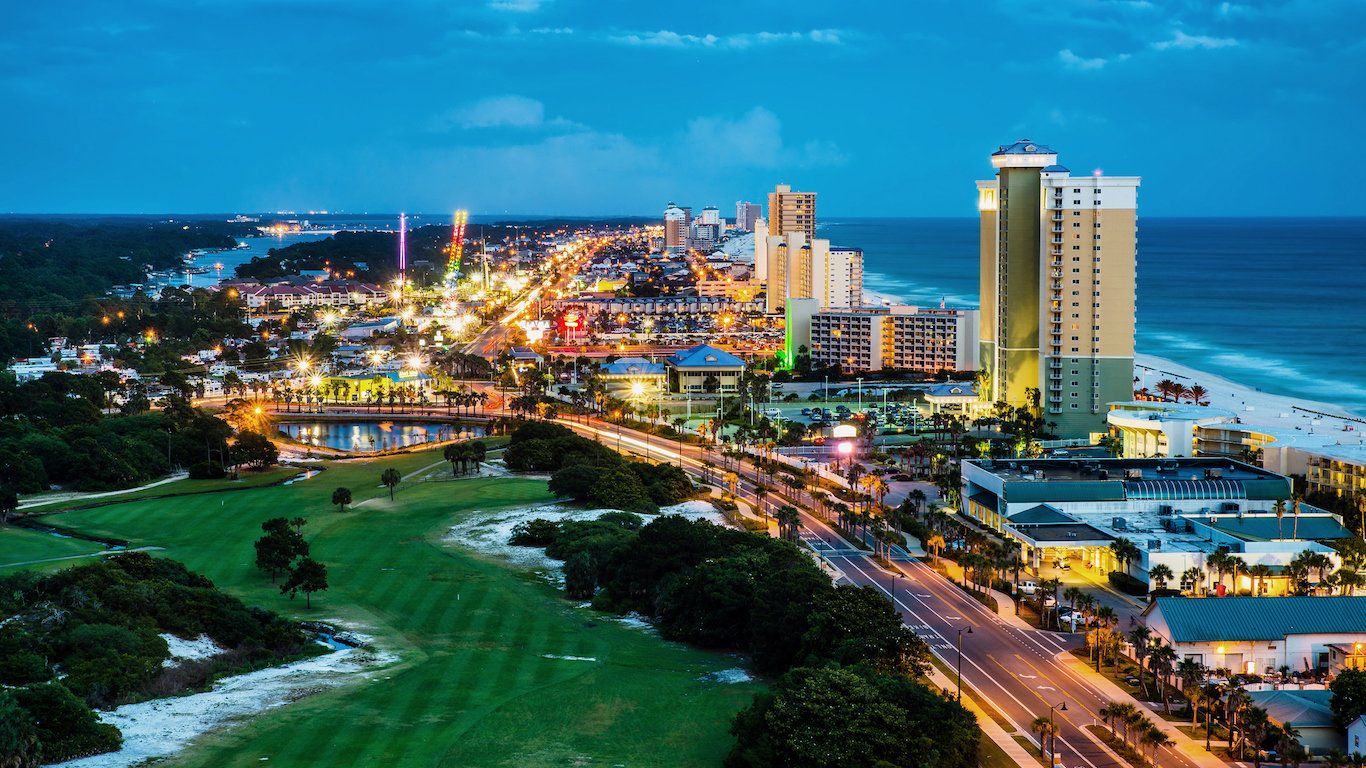
43. Florida
> Traffic fatality risk for elderly vs. total pop.: 1.6% more likely
> Traffic fatalities, 65 and older: 12.7 per 100,000 (25th highest)
> Traffic fatalities, total pop.: 12.5 per 100,000 (20th highest)
> Pct. pop. 85 and older: 2.6% (3rd highest)
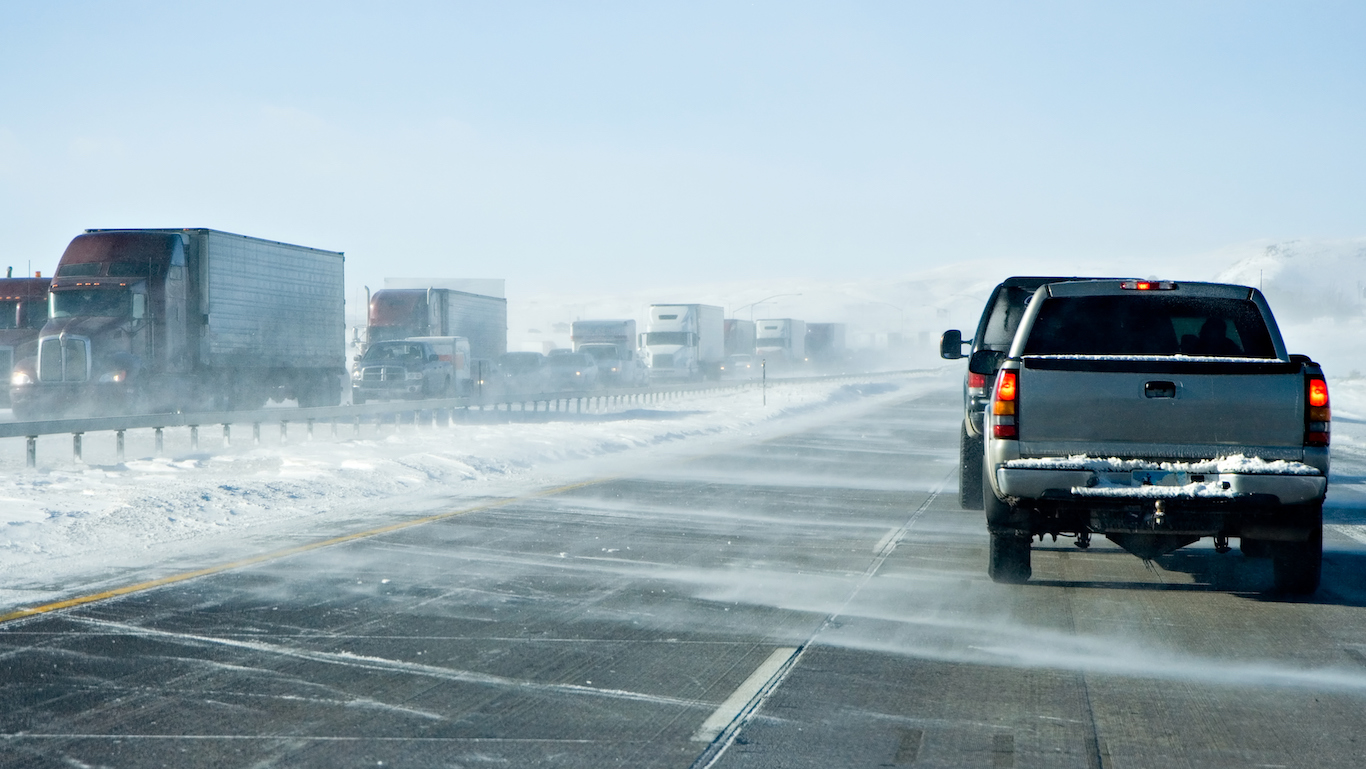
42. Wyoming
> Traffic fatality risk for elderly vs. total pop.: 1.8% more likely
> Traffic fatalities, 65 and older: 26.1 per 100,000 (the highest)
> Traffic fatalities, total pop.: 25.7 per 100,000 (the highest)
> Pct. pop. 85 and older: 1.4% (6th lowest)
[wallst_email_signup]
41. Vermont
> Traffic fatality risk for elderly vs. total pop.: 6.8% more likely
> Traffic fatalities, 65 and older: 7.5 per 100,000 (4th lowest)
> Traffic fatalities, total pop.: 7.0 per 100,000 (9th lowest)
> Pct. pop. 85 and older: 2.1% (tied-14th highest)

40. Connecticut
> Traffic fatality risk for elderly vs. total pop.: 7.0% more likely
> Traffic fatalities, 65 and older: 7.4 per 100,000 (3rd lowest)
> Traffic fatalities, total pop.: 6.9 per 100,000 (8th lowest)
> Pct. pop. 85 and older: 2.4% (tied-5th highest)
39. Alabama
> Traffic fatality risk for elderly vs. total pop.: 7.7% more likely
> Traffic fatalities, 65 and older: 18.2 per 100,000 (7th highest)
> Traffic fatalities, total pop.: 16.9 per 100,000 (8th highest)
> Pct. pop. 85 and older: 1.7% (tied-18th lowest)
[recirclink id=344740]

38. Arkansas
> Traffic fatality risk for elderly vs. total pop.: 8.1% more likely
> Traffic fatalities, 65 and older: 17.0 per 100,000 (12th highest)
> Traffic fatalities, total pop.: 15.7 per 100,000 (11th highest)
> Pct. pop. 85 and older: 1.9% (tied-25th highest)
37. Colorado
> Traffic fatality risk for elderly vs. total pop.: 11.4% more likely
> Traffic fatalities, 65 and older: 10.2 per 100,000 (12th lowest)
> Traffic fatalities, total pop.: 9.1 per 100,000 (20th lowest)
> Pct. pop. 85 and older: 1.5% (7th lowest)
[nativounit]
36. West Virginia
> Traffic fatality risk for elderly vs. total pop.: 11.6% more likely
> Traffic fatalities, 65 and older: 16.4 per 100,000 (14th highest)
> Traffic fatalities, total pop.: 14.7 per 100,000 (13th highest)
> Pct. pop. 85 and older: 2.1% (tied-14th highest)

35. Indiana
> Traffic fatality risk for elderly vs. total pop.: 13.6% more likely
> Traffic fatalities, 65 and older: 12.9 per 100,000 (24th highest)
> Traffic fatalities, total pop.: 11.3 per 100,000 (25th highest)
> Pct. pop. 85 and older: 1.9% (tied-25th highest)

34. Texas
> Traffic fatality risk for elderly vs. total pop.: 14.7% more likely
> Traffic fatalities, 65 and older: 15.1 per 100,000 (17th highest)
> Traffic fatalities, total pop.: 13.1 per 100,000 (16th highest)
> Pct. pop. 85 and older: 1.3% (tied-5th lowest)
[wallst_email_signup]
33. Kentucky
> Traffic fatality risk for elderly vs. total pop.: 15.7% more likely
> Traffic fatalities, 65 and older: 17.6 per 100,000 (8th highest)
> Traffic fatalities, total pop.: 15.2 per 100,000 (12th highest)
> Pct. pop. 85 and older: 1.8% (tied-23rd lowest)

32. Nebraska
> Traffic fatality risk for elderly vs. total pop.: 17.4% more likely
> Traffic fatalities, 65 and older: 14.0 per 100,000 (20th highest)
> Traffic fatalities, total pop.: 12.0 per 100,000 (21st highest)
> Pct. pop. 85 and older: 2.1% (tied-14th highest)
[nativounit]
31. North Carolina
> Traffic fatality risk for elderly vs. total pop.: 17.7% more likely
> Traffic fatalities, 65 and older: 15.2 per 100,000 (16th highest)
> Traffic fatalities, total pop.: 12.9 per 100,000 (18th highest)
> Pct. pop. 85 and older: 1.7% (tied-18th lowest)
30. Wisconsin
> Traffic fatality risk for elderly vs. total pop.: 18.0% more likely
> Traffic fatalities, 65 and older: 10.4 per 100,000 (14th lowest)
> Traffic fatalities, total pop.: 8.8 per 100,000 (17th lowest)
> Pct. pop. 85 and older: 2.2% (tied-10th highest)

29. Oklahoma
> Traffic fatality risk for elderly vs. total pop.: 18.7% more likely
> Traffic fatalities, 65 and older: 20.5 per 100,000 (2nd highest)
> Traffic fatalities, total pop.: 17.3 per 100,000 (6th highest)
> Pct. pop. 85 and older: 1.7% (tied-18th lowest)
[nativounit]
28. Georgia
> Traffic fatality risk for elderly vs. total pop.: 19.5% more likely
> Traffic fatalities, 65 and older: 13.8 per 100,000 (21st highest)
> Traffic fatalities, total pop.: 11.5 per 100,000 (22nd highest)
> Pct. pop. 85 and older: 1.3% (tied-5th lowest)
27. Nevada
> Traffic fatality risk for elderly vs. total pop.: 19.8% more likely
> Traffic fatalities, 65 and older: 12.2 per 100,000 (22nd lowest)
> Traffic fatalities, total pop.: 10.2 per 100,000 (24th lowest)
> Pct. pop. 85 and older: 1.3% (tied-5th lowest)
[recirclink id=344153]
26. Maryland
> Traffic fatality risk for elderly vs. total pop.: 20.0% more likely
> Traffic fatalities, 65 and older: 8.6 per 100,000 (6th lowest)
> Traffic fatalities, total pop.: 7.2 per 100,000 (10th lowest)
> Pct. pop. 85 and older: 1.8% (tied-23rd lowest)
25. New Hampshire
> Traffic fatality risk for elderly vs. total pop.: 20.1% more likely
> Traffic fatalities, 65 and older: 8.9 per 100,000 (7th lowest)
> Traffic fatalities, total pop.: 7.4 per 100,000 (12th lowest)
> Pct. pop. 85 and older: 2.1% (tied-14th highest)

24. South Dakota
> Traffic fatality risk for elderly vs. total pop.: 21.2% more likely
> Traffic fatalities, 65 and older: 19.3 per 100,000 (3rd highest)
> Traffic fatalities, total pop.: 15.9 per 100,000 (9th highest)
> Pct. pop. 85 and older: 2.4% (tied-5th highest)
[nativounit]
23. Iowa
> Traffic fatality risk for elderly vs. total pop.: 22.3% more likely
> Traffic fatalities, 65 and older: 12.6 per 100,000 (24th lowest)
> Traffic fatalities, total pop.: 10.3 per 100,000 (25th lowest)
> Pct. pop. 85 and older: 2.4% (tied-5th highest)
22. Arizona
> Traffic fatality risk for elderly vs. total pop.: 23.3% more likely
> Traffic fatalities, 65 and older: 14.1 per 100,000 (19th highest)
> Traffic fatalities, total pop.: 11.4 per 100,000 (23rd highest)
> Pct. pop. 85 and older: 1.8% (tied-23rd lowest)
[wallst_email_signup]
21. Michigan
> Traffic fatality risk for elderly vs. total pop.: 24.3% more likely
> Traffic fatalities, 65 and older: 11.3 per 100,000 (19th lowest)
> Traffic fatalities, total pop.: 9.1 per 100,000 (19th lowest)
> Pct. pop. 85 and older: 2.1% (tied-14th highest)
20. Virginia
> Traffic fatality risk for elderly vs. total pop.: 25.0% more likely
> Traffic fatalities, 65 and older: 10.6 per 100,000 (16th lowest)
> Traffic fatalities, total pop.: 8.4 per 100,000 (14th lowest)
> Pct. pop. 85 and older: 1.7% (tied-18th lowest)
19. Ohio
> Traffic fatality risk for elderly vs. total pop.: 25.1% more likely
> Traffic fatalities, 65 and older: 10.9 per 100,000 (18th lowest)
> Traffic fatalities, total pop.: 8.7 per 100,000 (15th lowest)
> Pct. pop. 85 and older: 2.1% (tied-14th highest)
[recirclink id=343890]

18. Missouri
> Traffic fatality risk for elderly vs. total pop.: 26.6% more likely
> Traffic fatalities, 65 and older: 16.0 per 100,000 (15th highest)
> Traffic fatalities, total pop.: 12.6 per 100,000 (19th highest)
> Pct. pop. 85 and older: 2.0% (tied-23rd highest)
17. Tennessee
> Traffic fatality risk for elderly vs. total pop.: 28.3% more likely
> Traffic fatalities, 65 and older: 18.8 per 100,000 (4th highest)
> Traffic fatalities, total pop.: 14.7 per 100,000 (14th highest)
> Pct. pop. 85 and older: 1.6% (tied-11th lowest)
[nativounit]
16. California
> Traffic fatality risk for elderly vs. total pop.: 29.8% more likely
> Traffic fatalities, 65 and older: 11.7 per 100,000 (21st lowest)
> Traffic fatalities, total pop.: 9.0 per 100,000 (18th lowest)
> Pct. pop. 85 and older: 1.7% (tied-18th lowest)

15. Oregon
> Traffic fatality risk for elderly vs. total pop.: 29.8% more likely
> Traffic fatalities, 65 and older: 10.3 per 100,000 (13th lowest)
> Traffic fatalities, total pop.: 7.9 per 100,000 (13th lowest)
> Pct. pop. 85 and older: 2.1% (tied-14th highest)

14. Massachusetts
> Traffic fatality risk for elderly vs. total pop.: 31.6% more likely
> Traffic fatalities, 65 and older: 6.4 per 100,000 (the lowest)
> Traffic fatalities, total pop.: 4.9 per 100,000 (the lowest)
> Pct. pop. 85 and older: 2.2% (tied-10th highest)
[wallst_email_signup]
13. Delaware
> Traffic fatality risk for elderly vs. total pop.: 35.8% more likely
> Traffic fatalities, 65 and older: 17.6 per 100,000 (9th highest)
> Traffic fatalities, total pop.: 12.9 per 100,000 (17th highest)
> Pct. pop. 85 and older: 1.8% (tied-23rd lowest)
12. Illinois
> Traffic fatality risk for elderly vs. total pop.: 38.8% more likely
> Traffic fatalities, 65 and older: 10.0 per 100,000 (11th lowest)
> Traffic fatalities, total pop.: 7.2 per 100,000 (11th lowest)
> Pct. pop. 85 and older: 1.9% (tied-25th highest)
[nativounit]
11. Kansas
> Traffic fatality risk for elderly vs. total pop.: 39.1% more likely
> Traffic fatalities, 65 and older: 18.4 per 100,000 (6th highest)
> Traffic fatalities, total pop.: 13.3 per 100,000 (15th highest)
> Pct. pop. 85 and older: 2.1% (tied-14th highest)

10. Washington
> Traffic fatality risk for elderly vs. total pop.: 42.9% more likely
> Traffic fatalities, 65 and older: 13.4 per 100,000 (22nd highest)
> Traffic fatalities, total pop.: 9.3 per 100,000 (21st lowest)
> Pct. pop. 85 and older: 1.8% (tied-23rd lowest)

9. Pennsylvania
> Traffic fatality risk for elderly vs. total pop.: 44.1% more likely
> Traffic fatalities, 65 and older: 9.6 per 100,000 (10th lowest)
> Traffic fatalities, total pop.: 6.7 per 100,000 (7th lowest)
> Pct. pop. 85 and older: 2.5% (4th highest)
[nativounit]
8. Utah
> Traffic fatality risk for elderly vs. total pop.: 44.8% more likely
> Traffic fatalities, 65 and older: 9.5 per 100,000 (9th lowest)
> Traffic fatalities, total pop.: 6.5 per 100,000 (5th lowest)
> Pct. pop. 85 and older: 1.1% (2nd lowest)
7. Hawaii
> Traffic fatality risk for elderly vs. total pop.: 45.8% more likely
> Traffic fatalities, 65 and older: 9.1 per 100,000 (8th lowest)
> Traffic fatalities, total pop.: 6.2 per 100,000 (4th lowest)
> Pct. pop. 85 and older: 2.7% (tied-the highest)
[recirclink id=343925]
6. New Jersey
> Traffic fatality risk for elderly vs. total pop.: 48.1% more likely
> Traffic fatalities, 65 and older: 12.9 per 100,000 (23rd highest)
> Traffic fatalities, total pop.: 8.7 per 100,000 (16th lowest)
> Pct. pop. 85 and older: 2.2% (tied-10th highest)

5. Idaho
> Traffic fatality risk for elderly vs. total pop.: 49.6% more likely
> Traffic fatalities, 65 and older: 17.0 per 100,000 (11th highest)
> Traffic fatalities, total pop.: 11.4 per 100,000 (24th highest)
> Pct. pop. 85 and older: 1.6% (tied-11th lowest)
4. Maine
> Traffic fatality risk for elderly vs. total pop.: 50.7% more likely
> Traffic fatalities, 65 and older: 14.8 per 100,000 (18th highest)
> Traffic fatalities, total pop.: 9.8 per 100,000 (22nd lowest)
> Pct. pop. 85 and older: 2.4% (tied-5th highest)
[nativounit]
3. New York
> Traffic fatality risk for elderly vs. total pop.: 56.2% more likely
> Traffic fatalities, 65 and older: 8.2 per 100,000 (5th lowest)
> Traffic fatalities, total pop.: 5.3 per 100,000 (3rd lowest)
> Pct. pop. 85 and older: 2.2% (tied-10th highest)
2. Minnesota
> Traffic fatality risk for elderly vs. total pop.: 59.4% more likely
> Traffic fatalities, 65 and older: 10.5 per 100,000 (15th lowest)
> Traffic fatalities, total pop.: 6.6 per 100,000 (6th lowest)
> Pct. pop. 85 and older: 2.1% (tied-14th highest)
[wallst_email_signup]
1. Rhode Island
> Traffic fatality risk for elderly vs. total pop.: 118.5% more likely
> Traffic fatalities, 65 and older: 10.8 per 100,000 (17th lowest)
> Traffic fatalities, total pop.: 4.9 per 100,000 (2nd lowest)
> Pct. pop. 85 and older: 2.7% (tied-the highest)
Contact [email protected] for any questions or corrections.