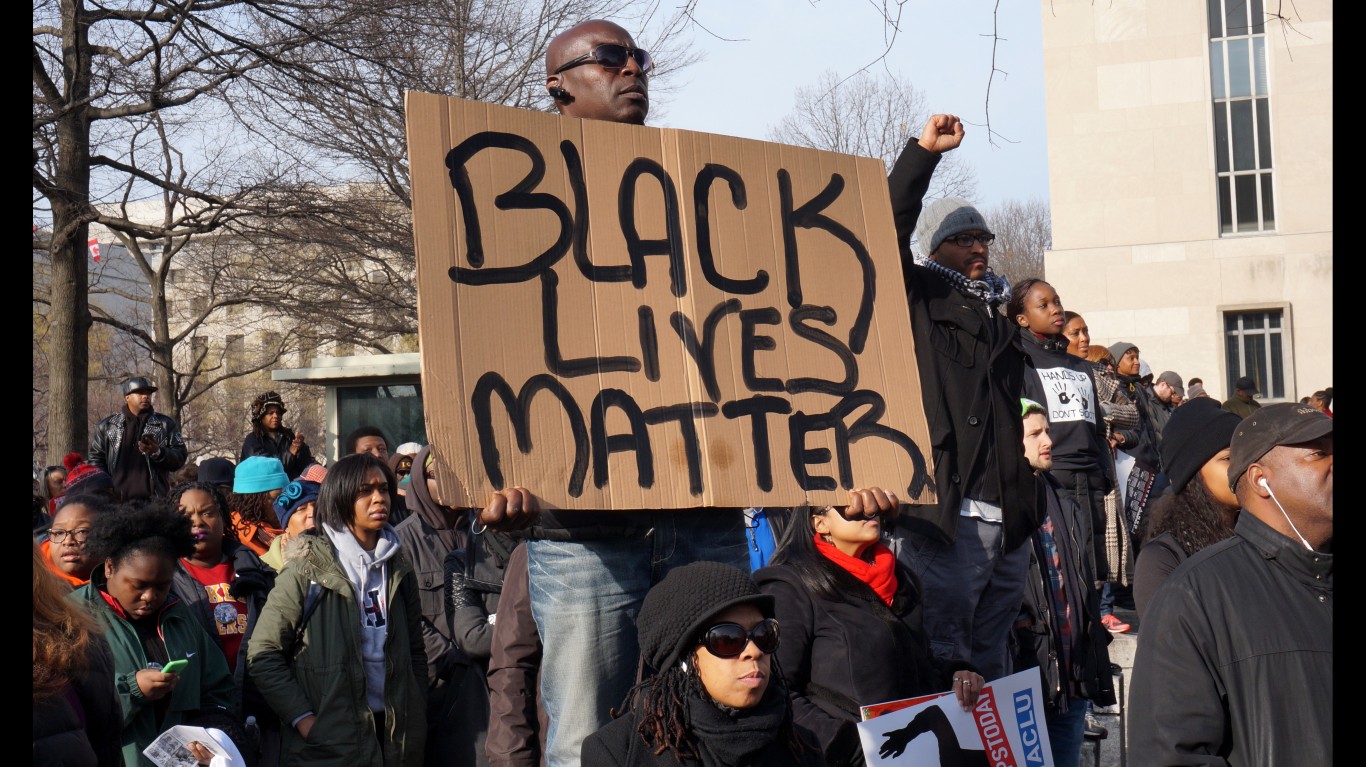
[cnxvideo id=”507733″ placement=”ros”]Highly publicized police shootings of young black men continue to fuel a national conversation on race. Groups such as Black Lives Matter have sought to highlight systemic racial inequality in the United States. Despite the achievements of the Civil Rights Movement over 50 years ago, many systemic inequalities persist — and some have worsened.
An examination of educational attainment, wages, unemployment, incarceration rates, and other measures among black and white populations across U.S. cities reveals consistently worse outcomes among blacks. The wider the gaps, the more severe the level of inequality. 24/7 Wall St. reviewed 10 cities with the greatest inequality between whites and blacks.
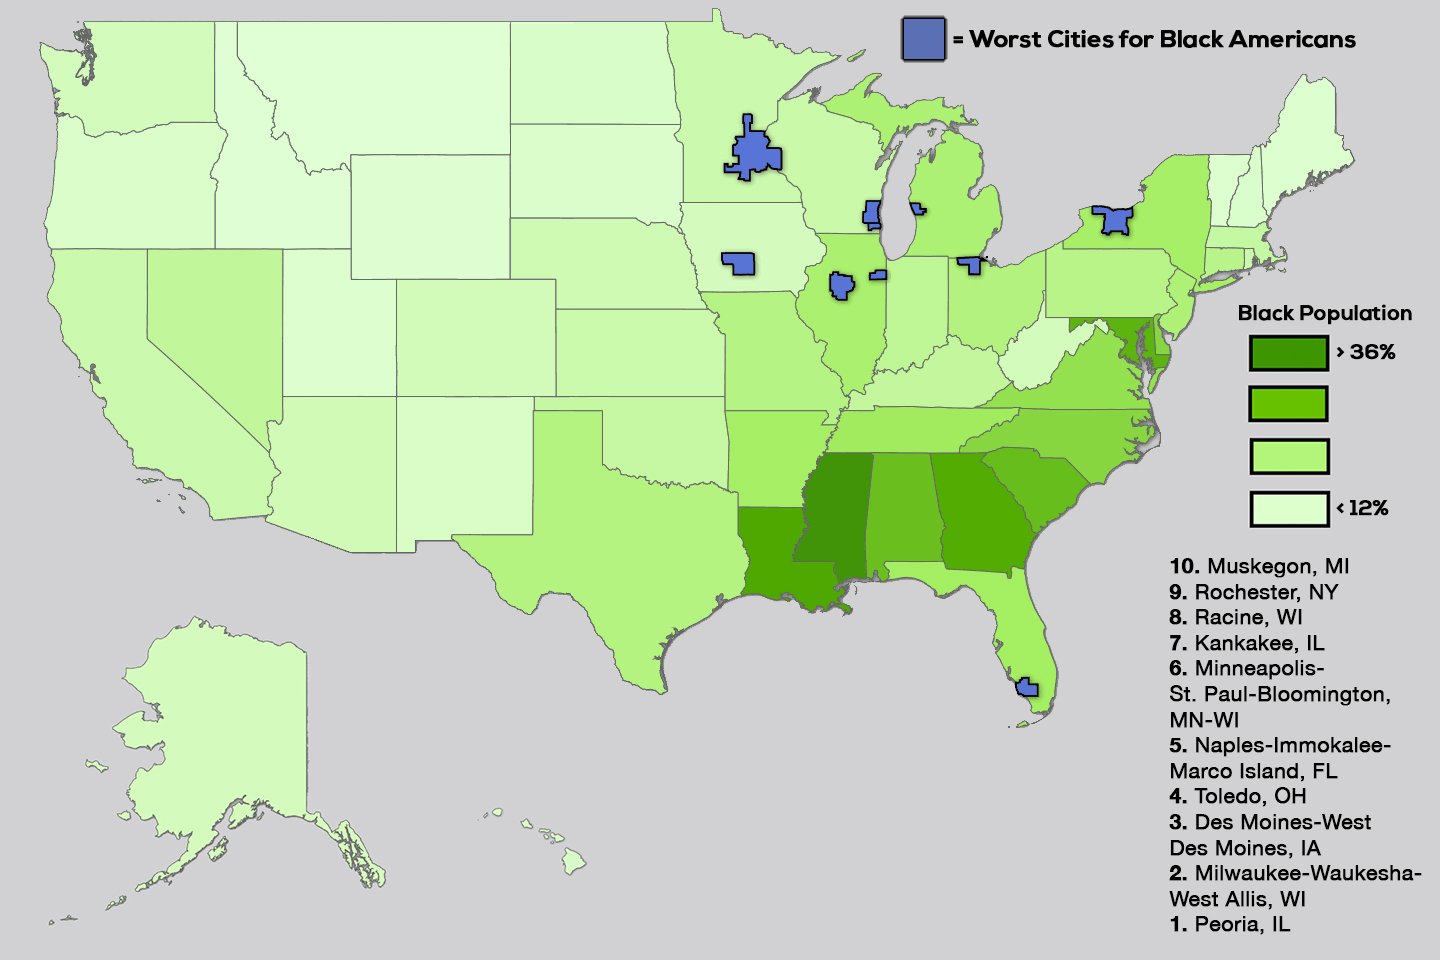
(Click image to enlarge)
Valerie Wilson, director of the Program on Race, Ethnicity, and the Economy at the left-leaning think tank Economic Policy Institute, revealed an alarming trend. In a recent publication, Wilson found that even when age, regional factors, experience, and education levels are controlled for, the wage gap between black and white U.S. workers has widened over the past several decades.
Click here to see the worst cities for black Americans.
Eight of the 10 worst cities for black Americans are old industrial towns. In an interview with 24/7 Wall St. Wilson explained that the worsening racial wage gap across the nation and in these cities is related to broad macroeconomic trends such as the decline in manufacturing jobs. Partially because these occupations and others were once “the kinds of jobs that would have been available to people with less than a college degree,” in 1979 the smallest racial wage gap was in the Midwest. Today, racial disparities in Midwest cities remain the same or are worse than anywhere else in the country.
Today, the unemployment rate among black U.S. workers is 11.3%, twice the 5.3% rate among white workers. The two-to-one unemployment disparity, which is even larger in some areas, gives a snapshot of the vastly different means white and black Americans have of providing basic material needs. This one economic disparity is driven by and helps perpetuate other racial inequalities — from the proliferation of crime to disparate health outcomes to wage and wealth gaps.
The racial wealth gap is especially wide. In the 2015 study, Exploring the Racial Wealth Gap Using the Survey of Consumer Finances, researchers at the Federal Reserve Board found that the median net worth of white families in the United States is $134,000. The median net worth of black families, at $11,000, is a fraction of that amount.
Homes are by far the largest investment most Americans make, and the substantial disparity in homeownership rates between racial groups helps explain this wealth gap. Nationally, 68.5% of white individuals and families live in homes they own compared to a black homeownership rate of 40.9%. In the majority of the metro areas on this list, white homeownership is greater than 70%, while the black homeownership rate is less than 35%.
The 13th amendment officially abolished slavery in the United States. While progress has been made over the years, in one area — incarceration and imprisonment — it seems inequality has worsened. As Wilson explained, the tough-on-crime era over the course of the ongoing war on drugs has disproportionately affected young black men. White and black incarceration rates have always been very different, but during that time the imprisonment of black individuals increased dramatically, and it continues today.
For every 100,000 white people, there are 275 in U.S. prisons. By contrast, the incarceration rate among black Americans is 1,408 per 100,000 African Americans. In most of the cities on this list, the white incarceration rates are lower than the national rate, while the black incarceration rates are higher than the respective national rate.
Certain policies have also contributed to the lopsided racial incarceration rates. For example, under the broad set of policies known as the war on drugs, offenses related to crack cocaine, a drug more common among black drug users, require harsher sentences than offenses related to powdered cocaine, a drug more common among white drug users. The separately classified drugs, however, are essentially the same substance.
Click here to read our methodology.
These are the worst cities for black americans.

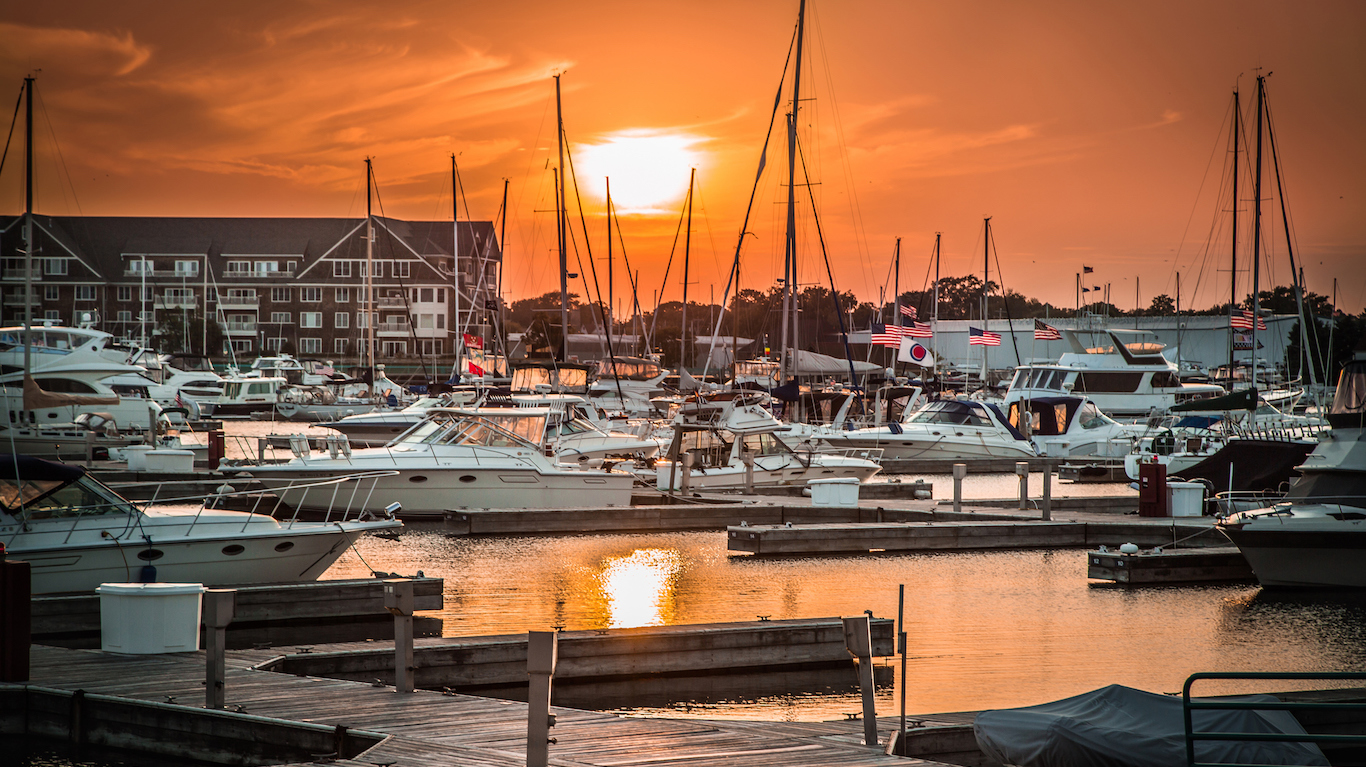
10. Muskegon, MI
> Black population: 13.9%
> Black median income: 40.0% of white income
> White unemployment: 5.0%
> Black unemployment: 23.8%
Muskegon is one of the worst cities for black Americans because of the large gap between the area’s white and black residents in a number of socioeconomic measures.
[in-text-ad]
Muskegon’s annual white unemployment rate of 5.0% is only slightly below the national 2015 unemployment rate of 5.3%. However, 23.8% of the city’s black workforce was unemployed. This 18.8 percentage point difference between the white and black jobless rates is among the greatest of any major metropolitan area.
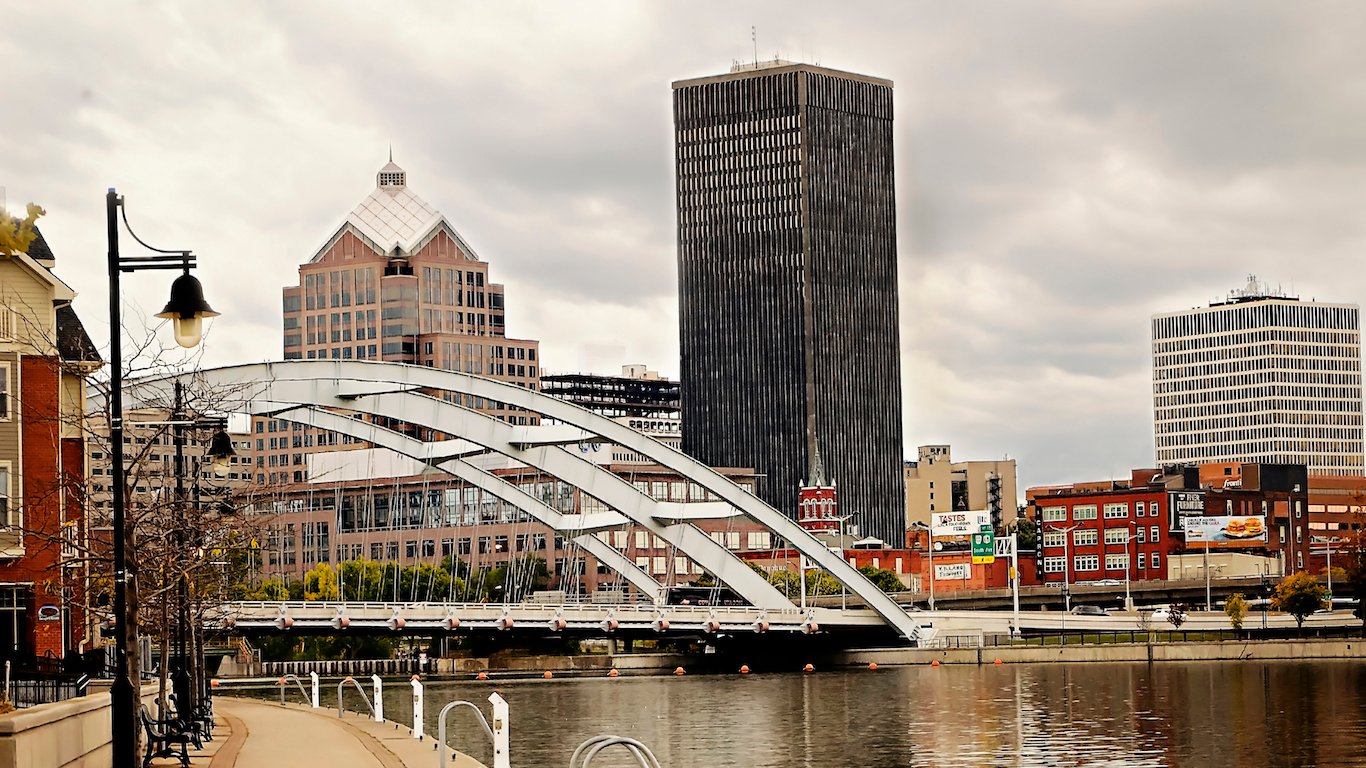
9. Rochester, NY
> Black population: 11.9%
> Black median income: 51.4% of white income
> White unemployment: 4.9%
> Black unemployment: 17.2%
Black Rochester residents are more than three times as likely to live in poverty as white residents, and a typical black city household earns about half as much as the typical white city household. Nationwide, 31.9% of white adults have a college education compared to 20.2% of black adults. In Rochester, 35.1% of white adults in the city have earned a postsecondary degree, while just 12.7% of black adults have.
Like many metropolitan areas with high inequality, Rochester was once a booming industrial center. Manufacturing jobs have historically provided an opportunity for black Americans to work and earn a decent wage without a college education. For this reason, the city’s manufacturing industry downturn may have disproportionately hurt the area’s African American families.
[nativounit]
8. Racine, WI
> Black population: 11.5%
> Black median income: 36.0% of white income
> White unemployment: 4.7%
> Black unemployment: 14.0%
Some of the starkest inequalities in the United States can be found in the criminal justice system. Black Americans nationwide are roughly five times more likely to be imprisoned. In Racine, these issues are an even more pronounced. For every 100,000 black metro area residents, 2,542 are imprisoned — 11.5 times the white incarceration rate.
For those who leave prison, becoming gainfully employed and otherwise adjusting to normal life can be challenging. Whether or not the high incarceration rate has meaningfully affected black earnings, the typical black metropolitan household earns about one-third that of the typical white household. The black homeownership rate in Racine of 29.4% is less than half the white homeownership rate of 75.5%.
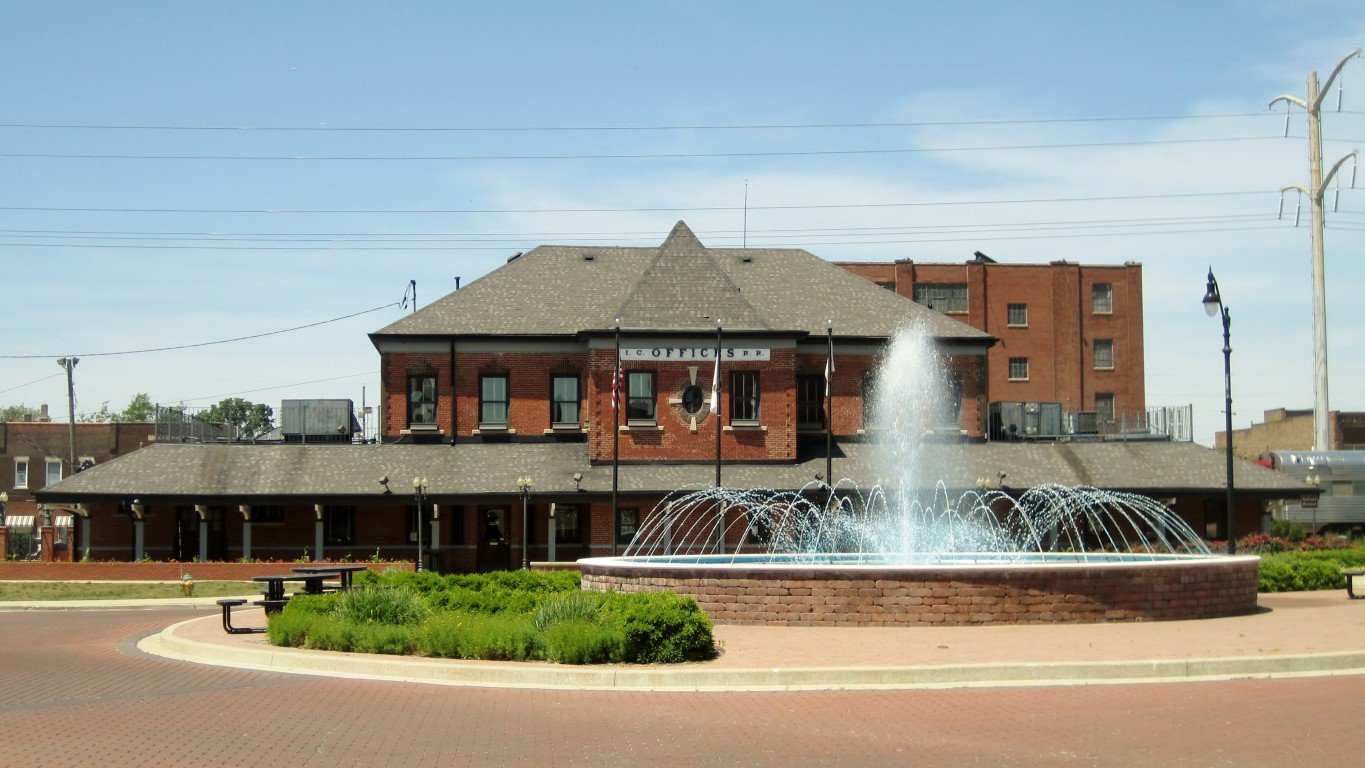
7. Kankakee, IL
> Black population: 15.8%
> Black median income: 46.2% of white income
> White unemployment: 6.2%
> Black unemployment: 16.5%
Only half a dozen U.S. cities have a greater socioeconomic gap between white and black residents than Kankakee, Illinois. Fewer than three-quarters of the city’s black adults have completed high school compared to nearly 90% of white adults. The share of white city adults who have earned a bachelor’s degree is more than double the corresponding rate among black adults.
[in-text-ad]
Gaps in educational attainment in Kankakee likely contributed to even greater discrepancies in economic outcomes. Nearly 43% of black Kankakee residents live in poverty, one of the highest shares of any U.S. metro areas. Conversely, fewer than one in 10 white area residents live below the poverty line.

6. Minneapolis-St. Paul-Bloomington, MN-WI H
> Black population: 8.0%
> Black median income: 42.0% of white income
> White unemployment: 3.5%
> Black unemployment: 9.1%
Homeownership, while not included in income measures, can greatly increase an individual’s net worth. In the Minneapolis metro area, white residents are far more likely to own a home than black residents. The white homeownership rate in the metro area of 74.5% is more than triple the 22.6% black homeownership rate.
As the city is part of the rust belt, Minneapolis’s black workers once benefitted from the availability of relatively high-paying manufacturing jobs, which did not require an education. While these jobs were present, they contributed to greater income equality. Today, income disparity in the Twin Cities metro area is a clear issue. The typical white city household earns $75,707 a year, more than double the income the typical black household earns annually.
[recirclink id=357589]

5. Naples-Immokalee-Marco Island, FL
> Black population: 7.0%
> Black median income: 64.2% of white income
> White unemployment: 3.5%
> Black unemployment: 14.5%
The direct value of owning a home in the United States is not as clear-cut as it used to be, as evidenced by the subprime housing crisis. That being said, homeownership is still generally a sign of prosperity and financial stability. In the Naples metro area, 32.3% of black families and individuals live in homes they own, while the white homeownership rate is 73.8%.
Educational attainment is similarly divided along racial lines in Naples. While 36.6% of the area’s white adults graduated from college, just 8% of the area’s black adults have.
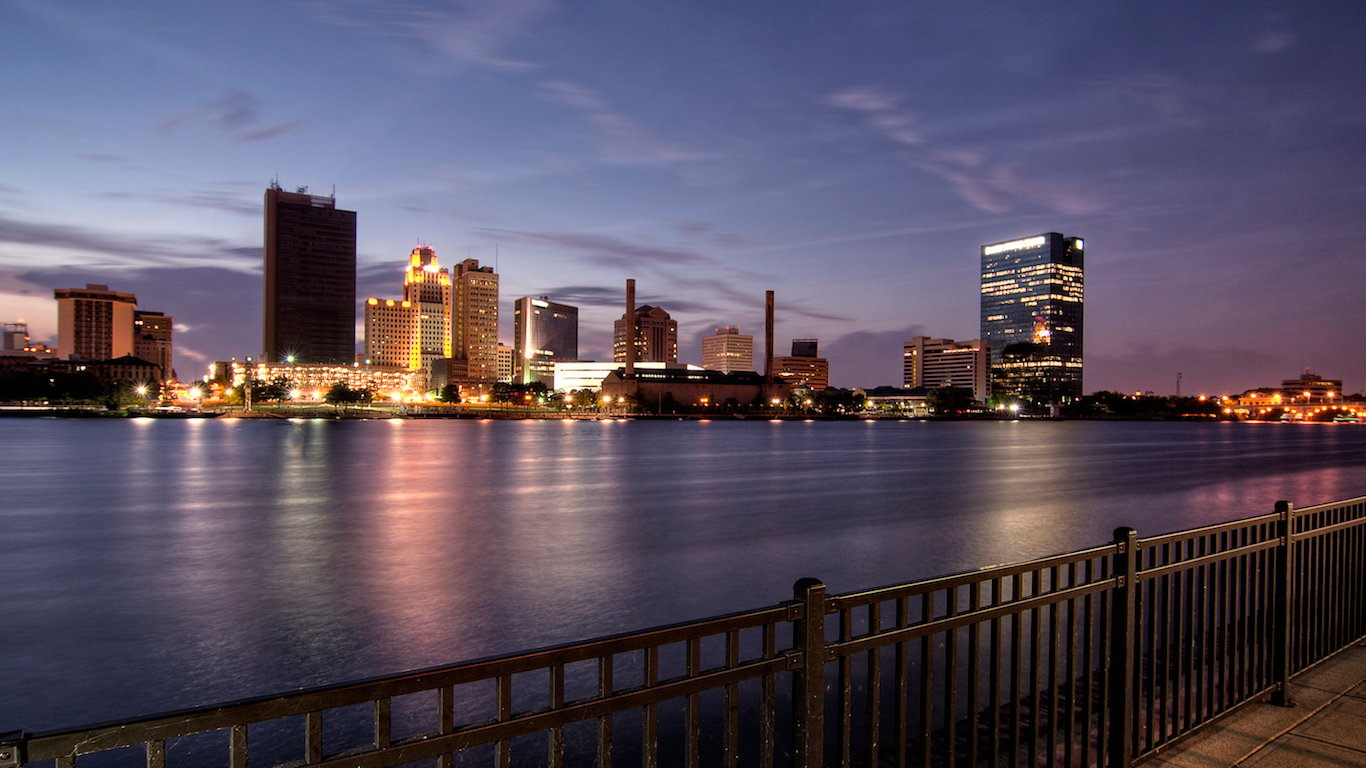
4. Toledo, OH
> Black population: 14.0%
> Black median income: 44.4% of white income
> White unemployment: 4.9%
> Black unemployment: 21.0%
Black Americans are more than twice as likely to live in poverty as white Americans. In Toledo, the disparity is even greater. While 11.2% of the metro area’s whites live below the poverty line, an estimated 41.8% of the area’s black residents do.
[in-text-ad]
Like many of the cities on this list, Toledo was once one of the nation’s manufacturing strongholds. As long-term decline in manufacturing severely impaired Toledo’s economy, a loss of those jobs may have disproportionately hurt the metropolitan area’s black residents. Manufacturing jobs have historically been a source of decent pay for African Americans, at least in part because the work often did not require a college degree.

3. Des Moines-West Des Moines, IA
> Black population: 5.0%
> Black median income: 45.3% of white income
> White unemployment: 4.1%
> Black unemployment: 17.0%
Educational attainment gaps between white and black adults in the Des Moines metro area are not especially stark. What is striking, however, are the gaps in certain social and economic outcomes.
The annual unemployment rate among the black population in Des Moines of 17.0% is more than quadruple the 4.1% white unemployment rate. Similarly alarming is the disparity between white and black incarceration rates. Black Des Moines residents are 11 times more likely to be incarcerated than white residents. In comparison, across the country as a whole, black Americans are five times more likely to be incarcerated than white Americans.
[nativounit]
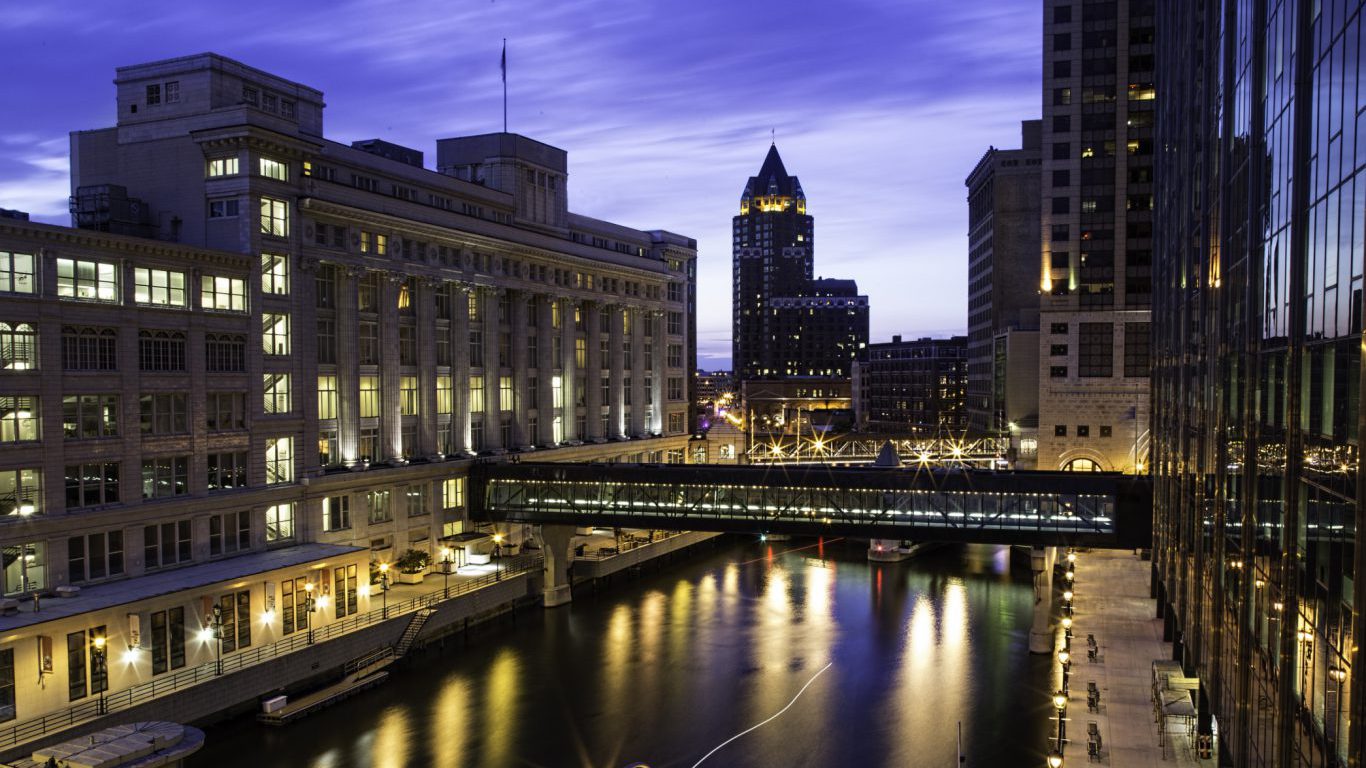
2. Milwaukee-Waukesha-West Allis, WI
> Black population: 16.5%
> Black median income: 45.2% of white income
> White unemployment: 2.9%
> Black unemployment: 13.7%
More than 2,500 of every 100,000 black Milwaukeeans are incarcerated, one of the highest imprisonment rates of any major metropolitan area. In contrast, just 221 of every 100,000 white residents are incarcerated.
Other forms of social and economic inequality, including poverty and unemployment, correlate with higher incarceration rates. This can at least partially be explained by the fact that former inmates often struggle to assimilate back into the community. In Milwaukee, while just 2.9% of the white workforce is unemployed, the black unemployment rate is 13.7%. Also, nearly one in three black Milwaukee residents live in poverty compared to just 8.7% of the area’s white population.
[wallst_email_signup]
1. Peoria, IL
> Black population: 9.3%
> Black median income: 46.5% of white income
> White unemployment: 5.4%
> Black unemployment: 15.3%
The poverty rate among black residents in Peoria is more than four times the white poverty rate of 8.2%. Multiple social and economic factors contribute to the significant discrepancy.
Black members of the workforce are far more likely to face difficulty in finding a job than their white counterparts. The black unemployment rate in the metro area is 15.3% compared to a 5.4% white unemployment rate. High incarceration rates also play a considerable role in contributing to regional inequality. Black Peoria residents are nearly nine times more likely to be incarcerated than white residents.
Methodology
To determine the 10 worst cities for black Americans, 24/7 Wall St. created an index of eight measures to assess race-based gaps in access to resources and opportunities in each of the nation’s metropolitan areas. Creating the index in this way ensured that cities were ranked on the differences between black and white Americans, and not on absolute levels of socioeconomic development. For each measure, we constructed an index from the gaps between black and white Americans. The index was standardized using interdecile normalization so outliers in the data did not skew results. We excluded metro areas where black residents comprised less than 5% of the population or where data limitations made comparisons between racial groups impossible.
[in-text-ad]
Within the index, we considered 2015 data from the U.S. Census Bureau’s American Community Survey on median household income, poverty, high school and bachelor’s educational attainment rates, homeownership rates, and unemployment rates. Data on incarceration rates came from The Sentencing Project and are for the most recent available year. Because states, rather than metro areas, are responsible for the prison population, incarceration rates are for the state where the metro area is located. If a metro area spanned more than one state, we used the state in which the metro area’s principal city is located. From the Centers for Disease Control and Prevention, we used age-adjusted mortality rates by race for each county in the U.S. from 2009-2013 to calculate mortality rates at the metro level using a variation on the indirect standardization method. Incarceration and mortality rates are per 100,000 total residents.
Contact [email protected] for any questions or corrections.