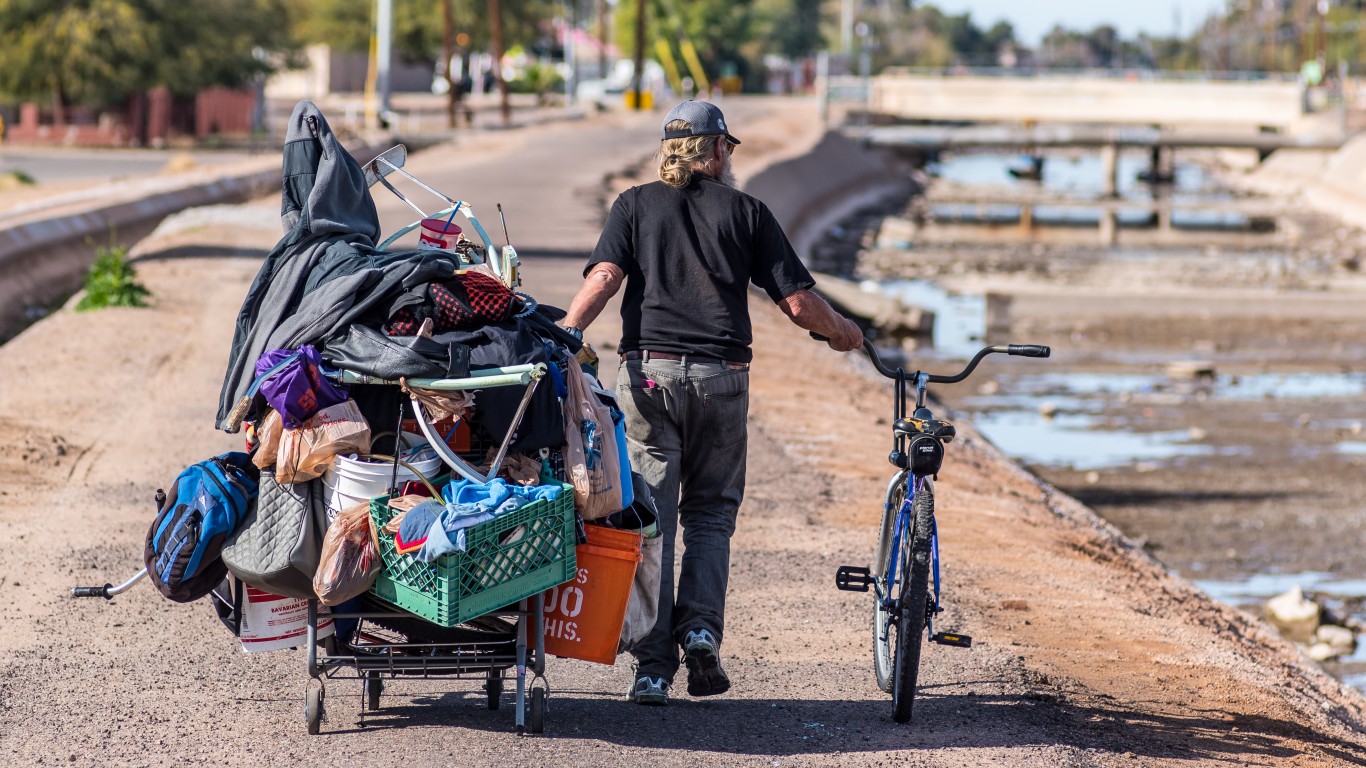
[cnxvideo id=”655426″ placement=”ros”]The official poverty rate has been criticized for decades. Based on traditional poverty measures, an estimated 45.7 million Americans live in poverty. However, when taxes, medical bills, and other expenses as well as benefits and assistance programs are accounted for the figure rises to about 47.8 million. This difference of 2.1 million Americans living above or below the poverty line is the difference between the official poverty rate and the supplemental poverty rate.
The official poverty measure, developed in the early 1960s, uses income from wages, Social Security benefits, interest, dividends, and pensions to determine the income of Americans and therefore whether or not someone is poor. By contrast, the supplemental poverty rate uses income after necessary costs like medical bills and living expenses are taken away, as well as after government subsidies like benefit programs and tax credits are added.
[in-text-ad]
In most states the supplemental poverty rate is higher than the official measure, meaning that on balance necessary expenses outweigh the benefits of government programs in these states. To determine where poverty is likely far worse than traditional estimates suggest, 24/7 Wall St. identified the states with the largest differences between the official and supplemental poverty rate.
Click here to see the states where poverty is worse than you think.
Hawaii has the largest such gap, with a 10.9% official poverty rate and a 16.8% supplemental poverty rate. According to the Census Bureau, the largest expenses pushing Americans into poverty are out-of-pocket medical costs, work-related expenses, and income tax.
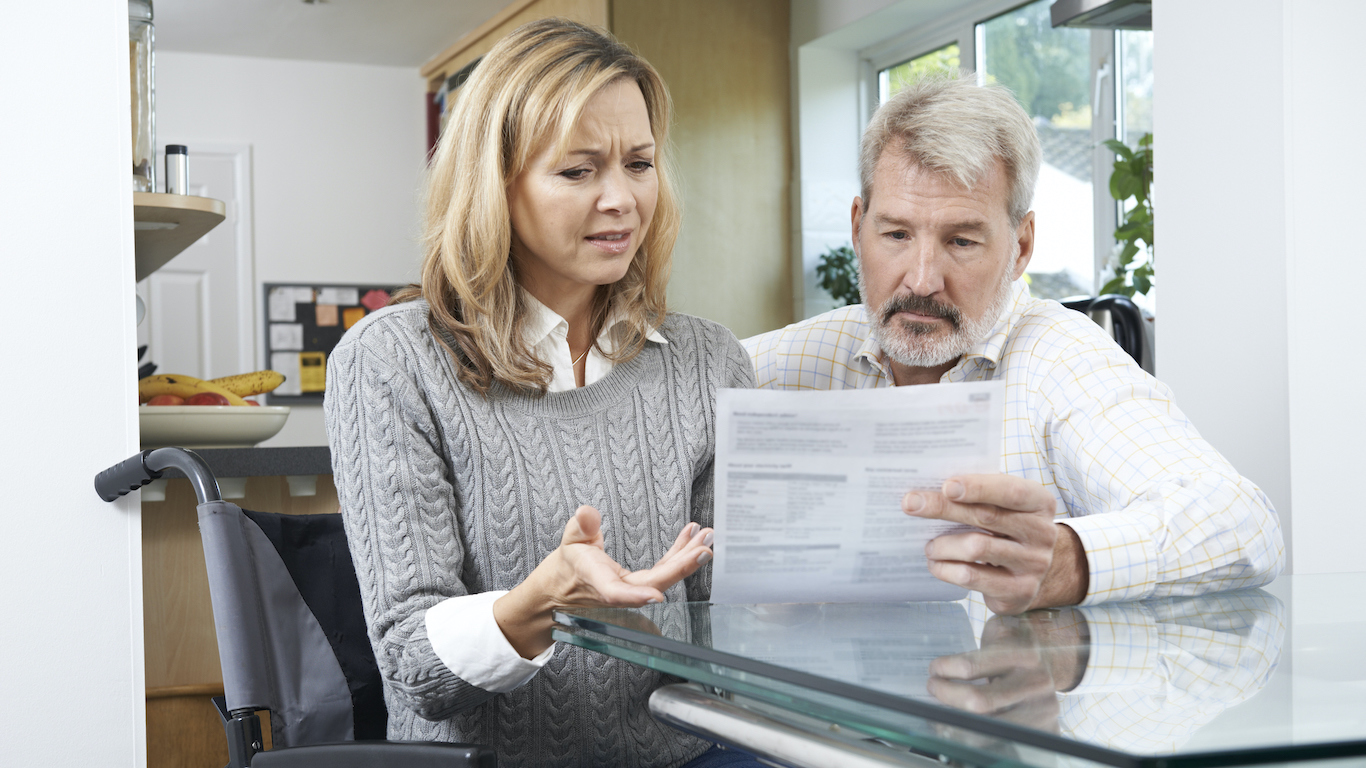
While more than nine in 10 Americans have health insurance, out-of-pocket expenses such as health insurance premiums, prescription drugs, and doctor copayments can can add significantly to household expenses. The nonprofit health organization Kaiser Family Foundation found that out-of-pocket deductibles for employees with health insurance increased to an average of $1,478 from $1,318 in 2015. For the 22% of U.S. households — roughly 25 million — earning less than $25,000 each year, a costly medical bill could be the difference between living above or below the poverty line. For those without health insurance, medical costs are likely even higher.
Housing is also a major expense for most families. The typical housing expense of owner-occupied homes nationwide is $17,724 a year, and in some states the housing cost is far higher. Seven of the 11 states where poverty is worse than it seems have among the highest housing costs of any state.
While not directly a part of the supplemental poverty rate measure, cost of living can also make a large difference to low-income households. High cost of living further adds to residents’ financial burdens. Of the 11 states on this list, the cost of living in nine is greater than the national average. Notably, in Hawaii, goods and services as well as housing costs are 17% more expensive than across the nation, the highest cost of living of any state.
The difference between official and supplemental poverty measures can vary by age group. For children, the supplemental poverty rate is often lower than the official poverty rate, because of the many benefits and assistance programs available to households with children. These payments sometimes help lift a low-income family above the supplemental poverty line.
On the other hand, the supplemental poverty rate for the elderly is often higher than the official poverty rate for the age group. The elderly are more likely to face far greater out-of-pocket medical expenses than the average American. Florida, which has the sixth largest difference between official and supplemental poverty rates, also has the largest elderly population of any state.
To determine the states where poverty is worse than you think, 24/7 Wall St. reviewed data from the Census Bureau’s recent release, “The Supplemental Poverty Measure: 2015.” The states were ranked on the percentage-point difference between the supplemental poverty rate and official poverty measure. While the official measure determines poverty status by considering a family or individual’s before-tax cash income, the supplemental poverty rate considers the sum of cash income plus noncash benefits and tax credits, minus taxes, work expenses, out-of-pocket medical expenses, and child support paid to another household. The poverty rates are a three-year average over 2013, 2014, and 2015. Data on median household income, health insurance coverage, housing costs and age came from the Census Bureau’s 2015 American Community Survey. Data on regional price parity, or cost of living, came from the Bureau of Economic Analysis and are for 2014. Unless otherwise specified, all data are for the most recent period available.
These are the states where poverty is worse than you think.

11. New Hampshire
> Supplemental poverty rate: 8.7% (the lowest)
> Official poverty rate: 6.7% (the lowest)
> Cost of living: 5.2% greater than nation (9th highest)
> Uninsured rate: 6.3% (13th lowest)
While both measures of poverty in New Hampshire — at 6.7% and 8.7% — are the lowest of any state, the difference between the two — at 2.0 percentage points — is tied as the 11th largest of all states. One reason for the difference may be New Hampshire’s high cost of living. Goods, services, and rent cost roughly five cents more on the dollar in New Hampshire than the country as a whole, a higher cost of living than in all but nine other states.
[in-text-ad]
Like the rest of the country, the difference between the official and supplemental poverty rate is more extreme among the elderly. When adjusted for taxes, medical bills, and other expenses, twice as many New Hampshire residents 65 and over live in poverty than according to the traditional poverty measure estimate.
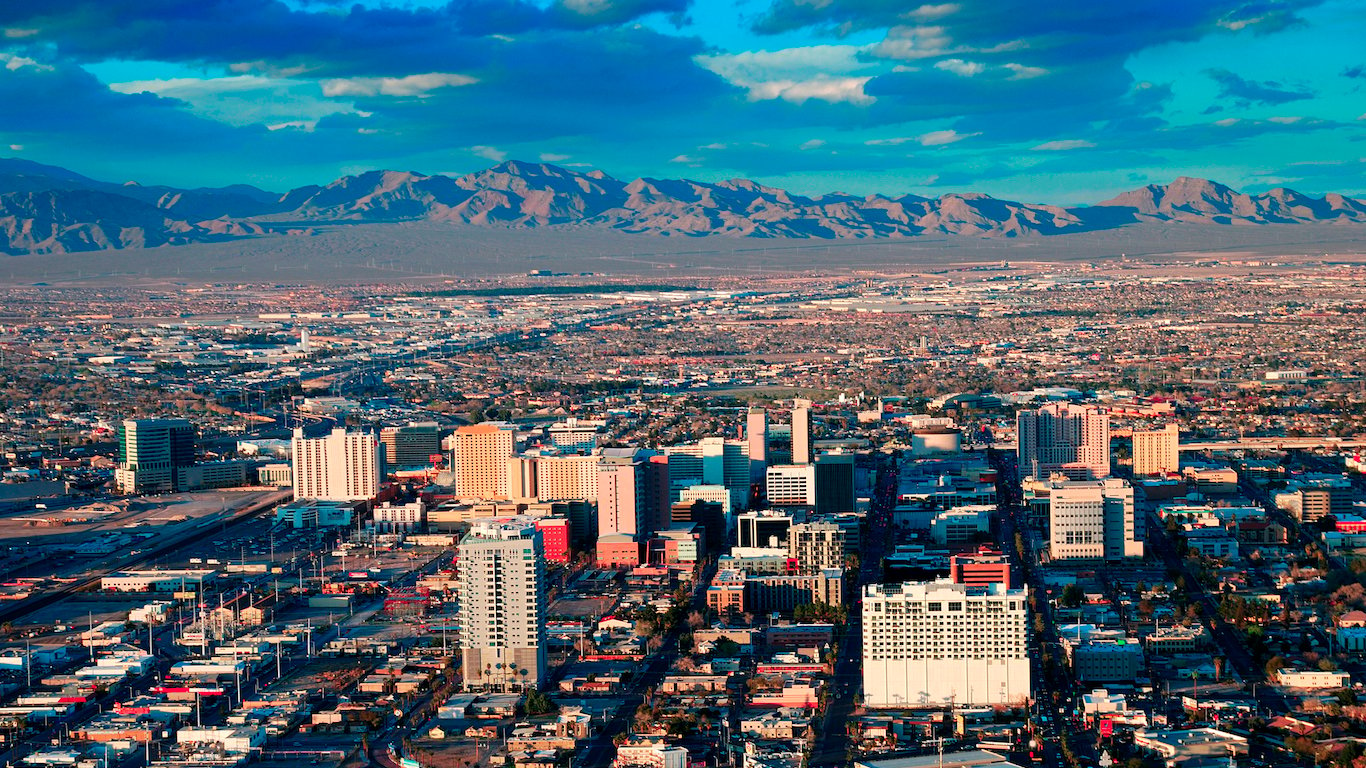
10. Nevada
> Supplemental poverty rate: 17.0% (7th highest)
> Official poverty rate: 14.9% (19th highest)
> Cost of living: -2.3% less than nation (20th highest)
> Uninsured rate: 12.3% (7th highest)
The typical Nevada household earns $52,431 annually, about $3,000 less than the national median household income. The state’s 14.9% official poverty rate is somewhat more in line with the official 14.5% national poverty rate. When taxes and other expenses are taken into account, however, the share of residents living in poverty is much larger. Nevada’s 17.0% supplemental poverty rate is the seventh highest in the country and substantially higher than the national supplemental poverty rate of 15.1%.
Unlike nearly every other state where poverty is worse than it seems, the cost of living in Nevada is lower than the national average.
[nativounit]
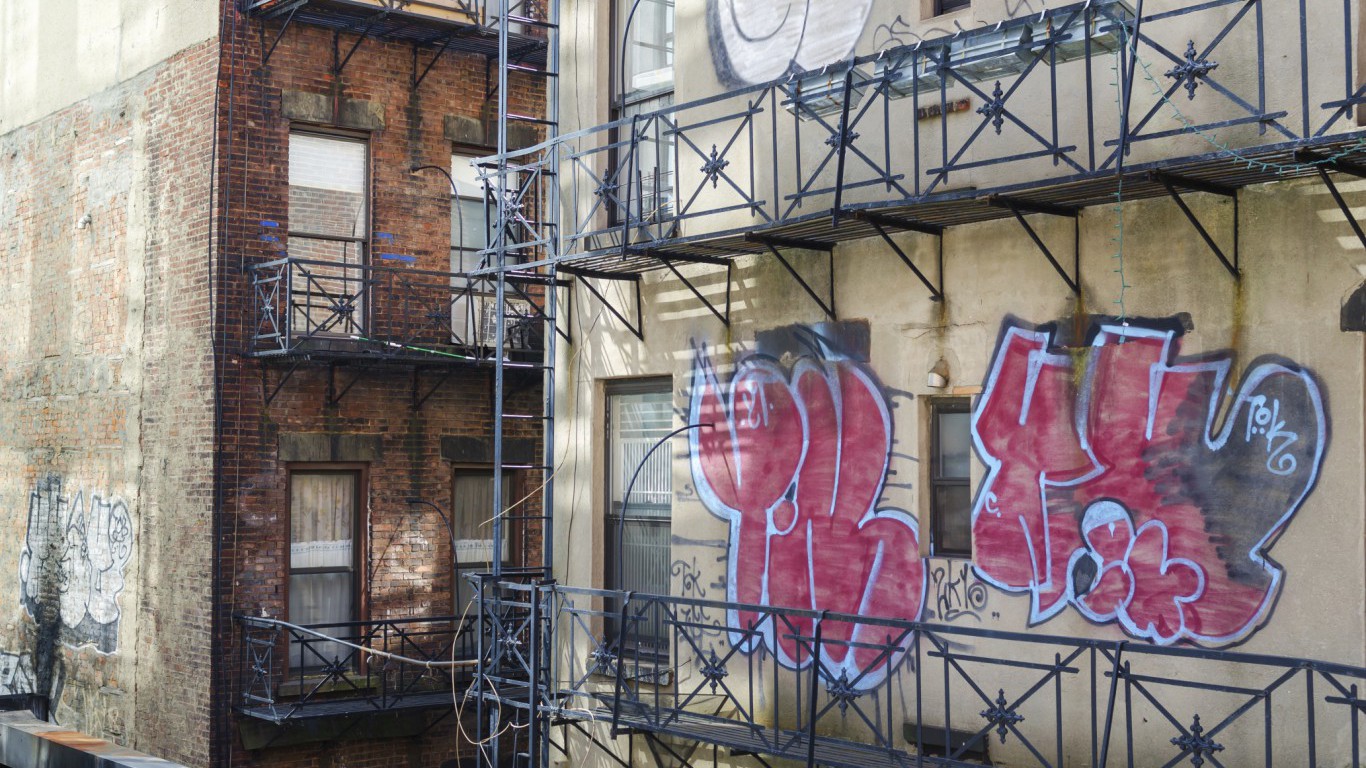
9. New York
> Supplemental poverty rate: 17.9% (3rd highest)
> Official poverty rate: 15.4% (16th highest)
> Cost of living: 15.7% greater than nation (2nd highest)
> Uninsured rate: 7.1% (20th lowest)
While the official count estimates that 3.0 million New York residents live in poverty, the figure climbs to 3.5 million residents when accounting necessary expenses — even after government subsidies are added to individual incomes. The nearly half a million-person difference is one of the largest of any state. The difference between the state’s official rate of 15.4% and the more comprehensive 17.9% supplemental rate is also one of the largest of any state.
One reason for the relatively high supplemental poverty figure is the high cost of living in New York. Rent, and goods and services cost 16 cents more on the dollar than across the country as a whole, the second highest cost of living of any state.

8. Massachusetts
> Supplemental poverty rate: 15.1% (14th highest)
> Official poverty rate: 12.5% (23rd lowest)
> Cost of living: 7.1% greater than nation (7th highest)
> Uninsured rate: 2.8% (the lowest)
The typical Massachusetts household earns $70,628 annually, roughly $15,000 more than the median household nationwide. With such relatively high incomes, just 12.5% of Massachusetts residents live below the poverty line, versus the official 14.5% national poverty rate. When adjusted for housing costs, taxes, medical bills, and other expenses, however, the state’s poverty rate climbs to 15.1%, matching the national supplemental poverty rate. The 2.6 percentage point difference between the official and supplemental poverty rates — representing 174,000 residents — may be partially due to the high cost of living in Massachusetts. Rent in the state is 23.5% more expensive than the national average, one of the largest rental price variations in the country.
[in-text-ad]

7. Virginia
> Supplemental poverty rate: 13.3% (25th highest)
> Official poverty rate: 10.3% (6th lowest)
> Cost of living: 2.6% greater than nation (11th highest)
> Uninsured rate: 9.1% (23rd highest)
Some 10.3% of Virginia residents live in poverty, the sixth smallest share of any state and well below the 14.5% national poverty rate. However, Virginia’s supplemental poverty rate — which considers taxes, cost of living, medical bills, and other expenses — is significantly higher at 13.3%. The large gap between the official and supplemental poverty measures may be due to the state’s relatively high cost of living. The average rent in Virginia, for example, costs about 12% more than across the country.
[recirclink id=357789]
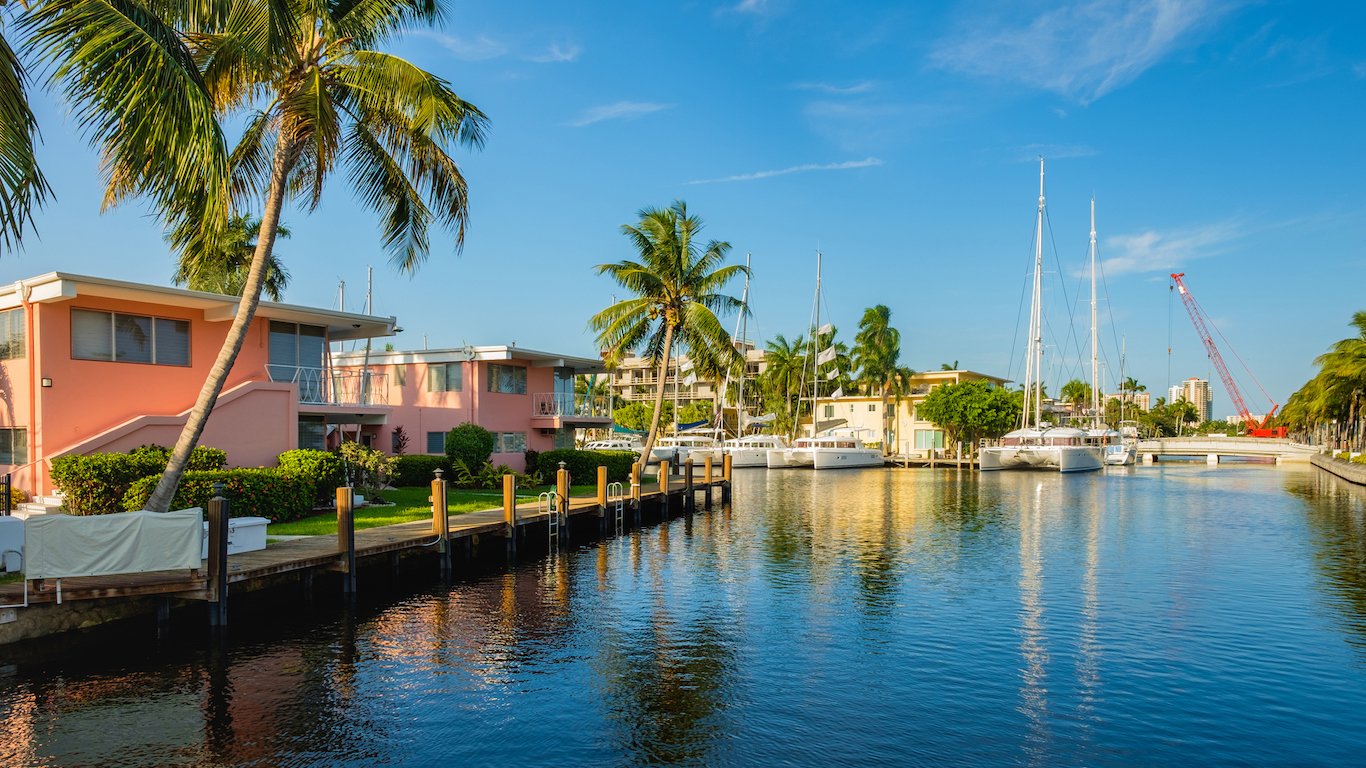
6. Florida
> Supplemental poverty rate: 19.0% (2nd highest)
> Official poverty rate: 16.0% (13th highest)
> Cost of living: -0.9% less than nation (16th highest)
> Uninsured rate: 13.3% (5th highest)
Based on income before taxes and transfers, an estimated 16% of Florida residents live in poverty, the 13th highest official poverty rate. When adjusted for taxes, cost of living, medical bills, and other expenses, however, Florida’s supplemental poverty rate of 19% is the highest of any state other than California. One explanation for the 3.0 percentage point difference, which represents approximately 600,000 Floridians, may be the high out-of-pocket medical expenses in the state. Medical expenses tend to increase in old age. Close to one in every five Florida residents are 65 or older, the highest share of any state.
Also, more than 13% of Florida residents lack health insurance, the fifth highest uninsured rate nationwide. For those without health insurance, high medical expenses may further increase the difficulty of staying out of poverty.
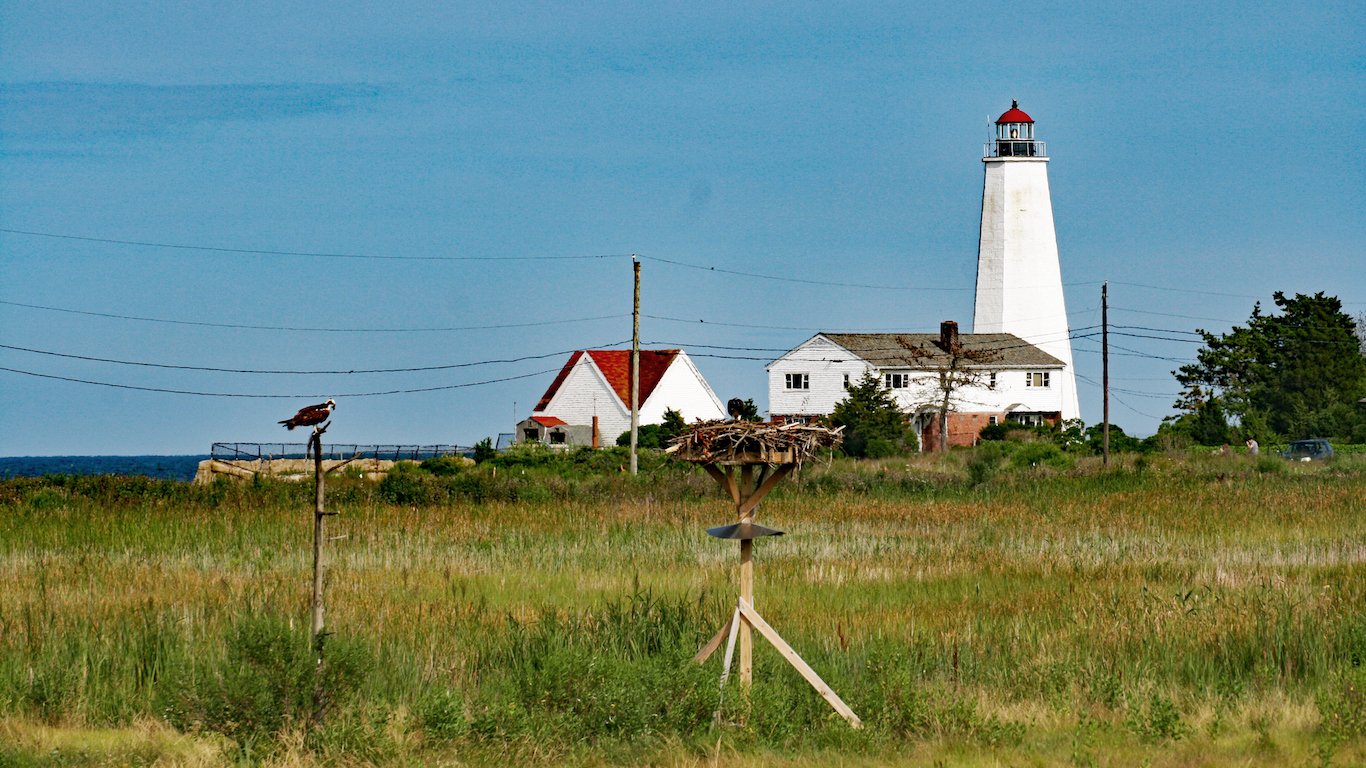
5. Connecticut
> Supplemental poverty rate: 12.8% (25th lowest)
> Official poverty rate: 9.6% (4th lowest)
> Cost of living: 8.8% greater than nation (6th highest)
> Uninsured rate: 6.0% (11th lowest)
The typical Connecticut household earns $71,346 annually, the fifth highest of any state. With such high incomes, the state’s official poverty rate of 9.6% is the fourth lowest of any state. When taxes, medical bills, cost of living, and other expenses are taken into account, however, the share of residents living in poverty is 12.8%. The cost of housing and groceries may, for some residents, mean the difference between living above or below the poverty line — and in Connecticut prices are generally high. Rent, goods and services as well as rents cost nearly 9% more in Connecticut than the average across the country, the sixth highest cost of living in the country.
[in-text-ad]

4. Maryland
> Supplemental poverty rate: 14.3% (19th highest)
> Official poverty rate: 10.1% (5th lowest)
> Cost of living: 10.3% greater than nation (5th highest)
> Uninsured rate: 6.6% (17th lowest)
The typical Maryland household earns $75,847 annually, the most of any state nationwide. With such high incomes, the pre-tax income poverty rate of 10.1% is one of the lowest of any state. When adjusted for taxes and other expenses, however, the poverty rate climbs to 14.3%. The 4.2 percentage point difference, representing roughly 250,000 residents, can be partially explained by the high cost of living in the state. Rent in Maryland is 27% more expensive than average rent costs nationwide. Costly housing and groceries may be pushing some residents below the poverty line.
[nativounit]
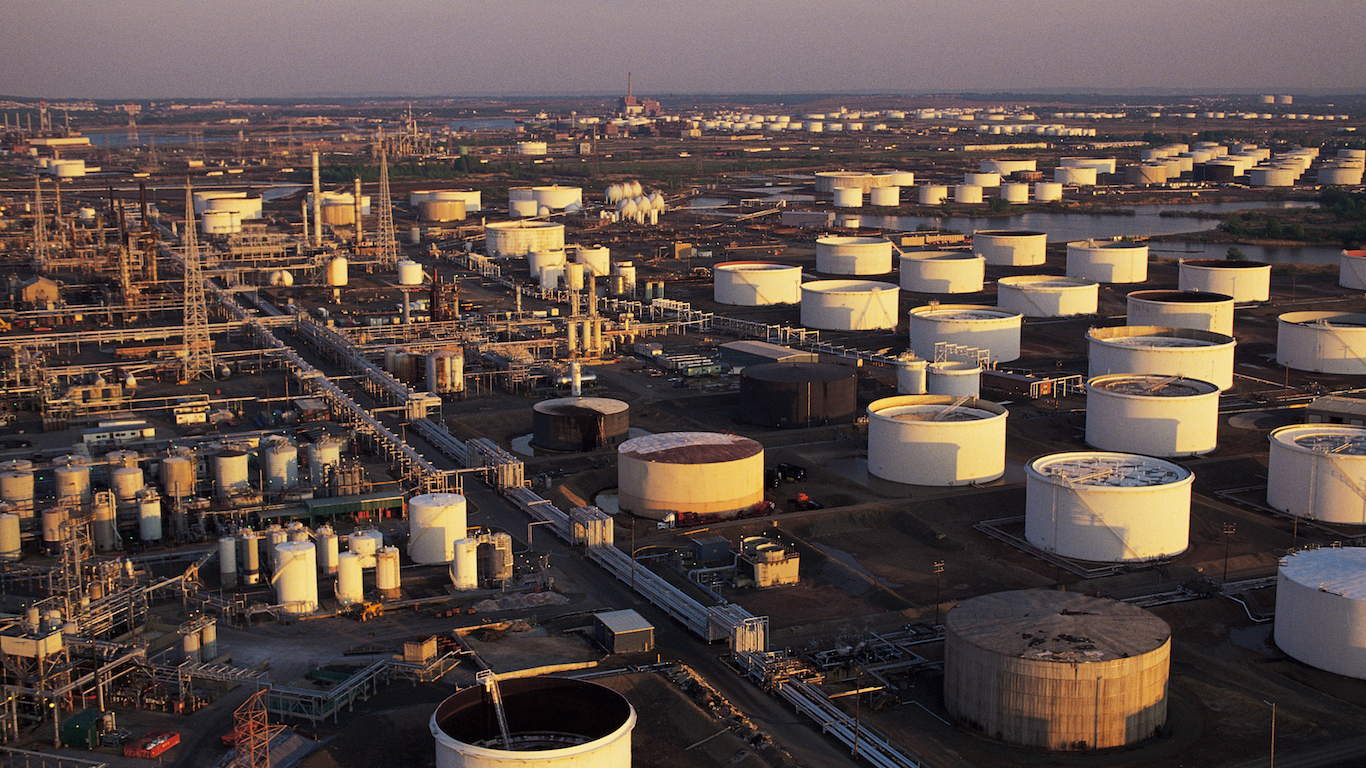
3. New Jersey
> Supplemental poverty rate: 15.1% (14th highest)
> Official poverty rate: 10.8% (10th lowest)
> Cost of living: 14.5% greater than nation (3rd highest)
> Uninsured rate: 8.7% (25th highest)
As with most states where the official poverty rate may underestimate actual poverty levels, New Jersey is one of the most expensive states to live in the nation. On average, goods and services cost 14.5% more than they do across the nation, trailing just two other states in cost of living. With high median incomes statewide, most residents get by with the high prices. For those living near poverty, however, the high prices mean they likely have more trouble making ends meet than in other states. Similarly, the typical homeowner with a mortgage in New Jersey pays $7,905 in real estate taxes, the highest of any state. After necessary costs such as these are subtracted from household finances, more residents in New Jersey fall below the poverty threshold.
2. California
> Supplemental poverty rate: 20.6% (the highest)
> Official poverty rate: 15.0% (17th highest)
> Cost of living: 12.4% greater than nation (4th highest)
> Uninsured rate: 8.6% (25th lowest)
The states with the largest differences between the measures of poverty still often have relatively low poverty rates — even by the more comprehensive supplemental measure. California’s 17th highest official poverty rate of 15.0%, however, is in stark contrast to the adjusted measure. At 20.6%, the state’s supplemental poverty rate is the highest in the country. As in many states, the discrepancy in California is largely due to the high cost of living in the state. The average rent in the state, for example, is close to 50% higher than it is across the nation.
[in-text-ad]
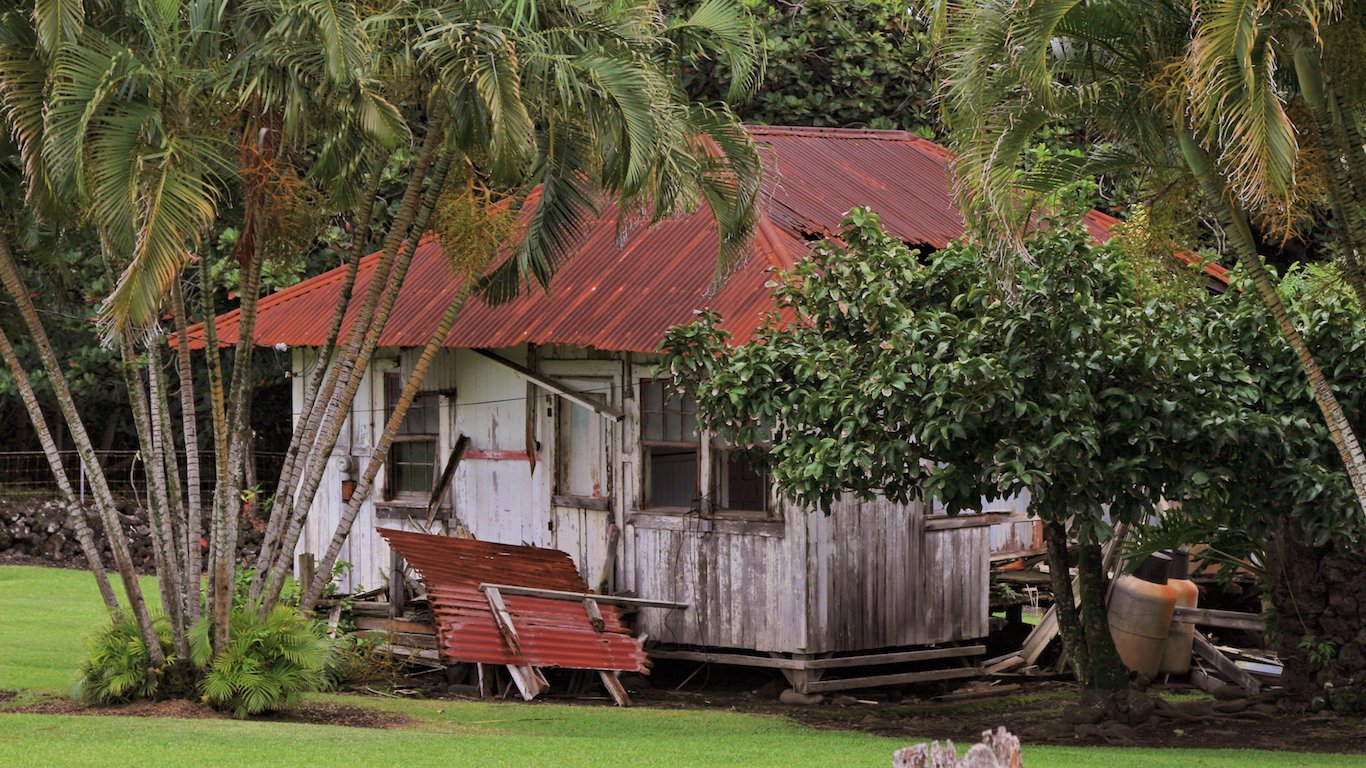
1. Hawaii
> Supplemental poverty rate: 16.8% (9th highest)
> Official poverty rate: 10.9% (11th lowest)
> Cost of living: 16.8% greater than nation (the highest)
> Uninsured rate: 4.0% (3rd lowest)
Hawaiians are some of the wealthiest people in the United States. The state’s median household income of $73,486 is the second highest after Maryland. This partially explains the state’s similarly high cost of living, which is the highest of any state by most metrics. The average cost of living is 16.8% higher than it is nationwide, the highest of any state. The average rent, close to 60% above nationwide average, is particularly high. While many Hawaiians can certainly afford the high cost of living, life is likely relatively difficult for the state’s poor.
Unlike most states where poverty is worse than it seems, medical expenses are a relatively small burden on Hawaiian residents. The Hawaiian government was among the very first to implement a near-universal health insurance system. Today, just 4% of residents do not have health insurance, the third lowest uninsured rate of any state.
[wallst_email_signup]
Contact [email protected] for any questions or corrections.