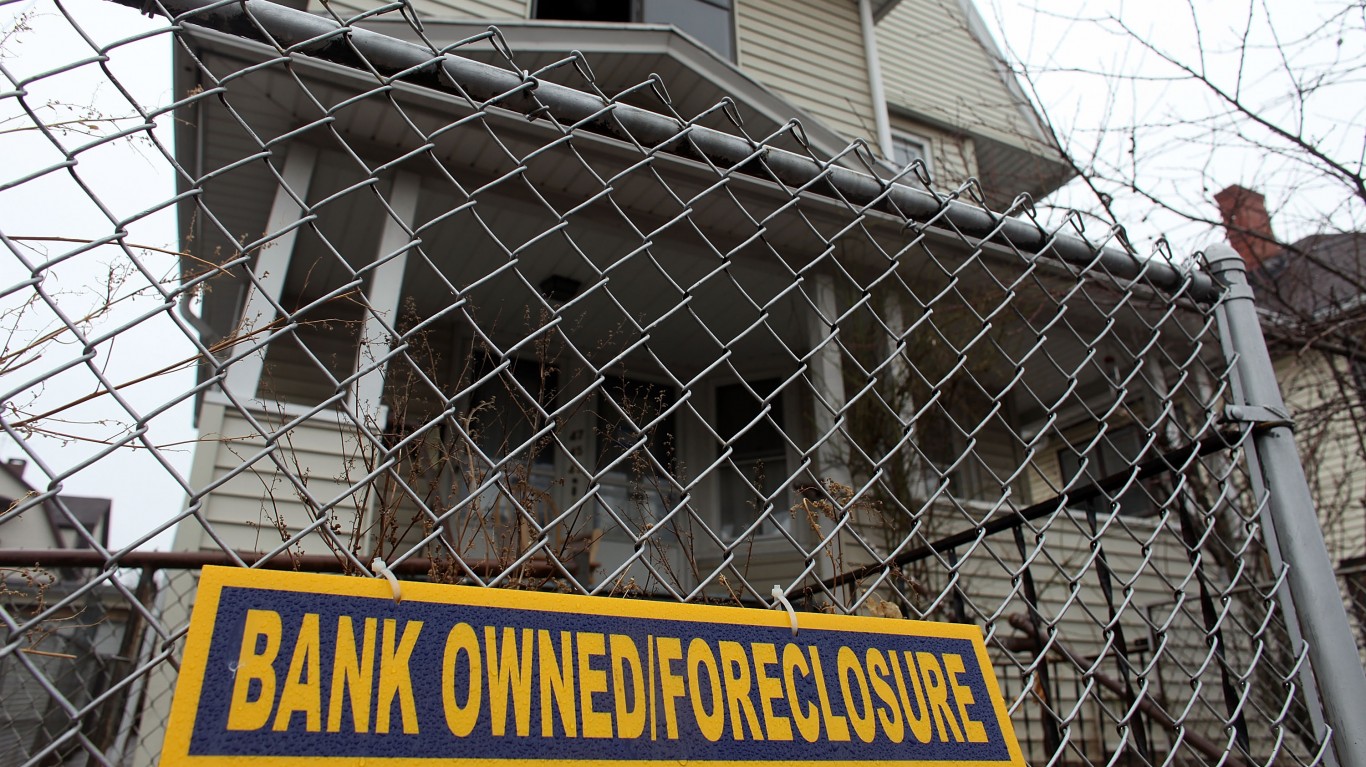
As the United States endures its 10th month of the health and economic crises resulting from the COVID-19 pandemic, many Americans continue to face serious economic hardship. While some managed to keep above the poverty threshold, many were pushed into poverty or deeper poverty.
Funds from the CARES Act, which Congress passed in late March to provide some economic relief during the pandemic, appear to be drying up, and the nationwide economic recovery has been slowing considerably in recent months. Approximately 21.9 million jobs were lost between February and April. While a little over half of that loss — 12.3 million jobs — were recovered over the following seven months, the 245,000 jobs employers added in November was the lowest job gain since the March-April crash.
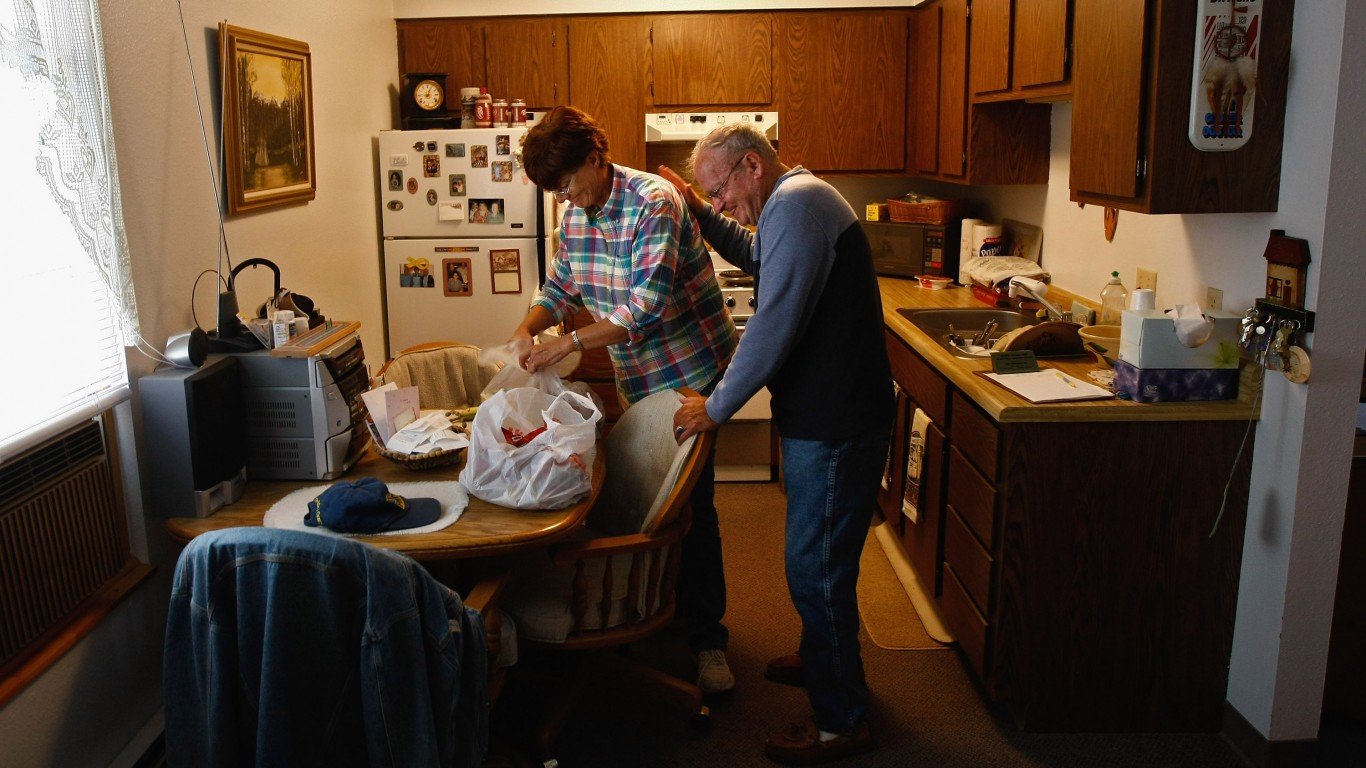
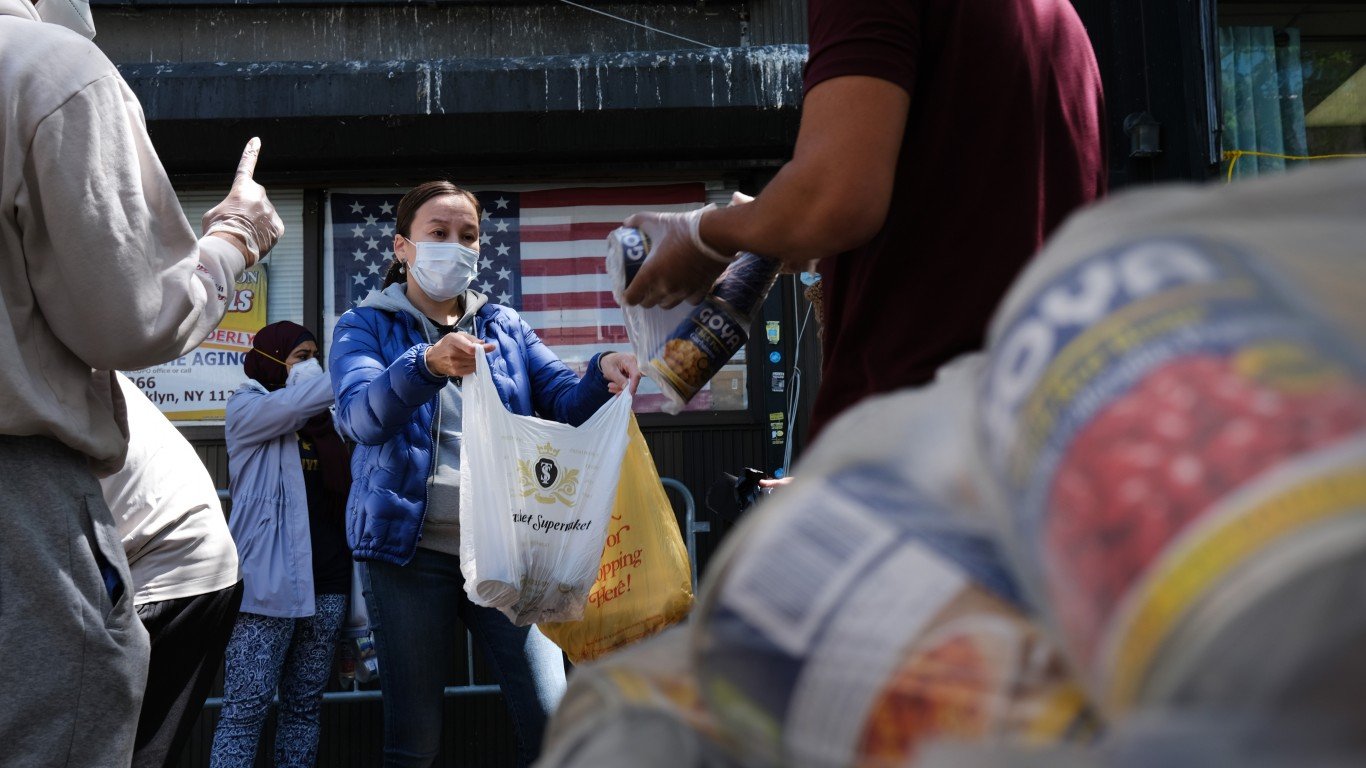
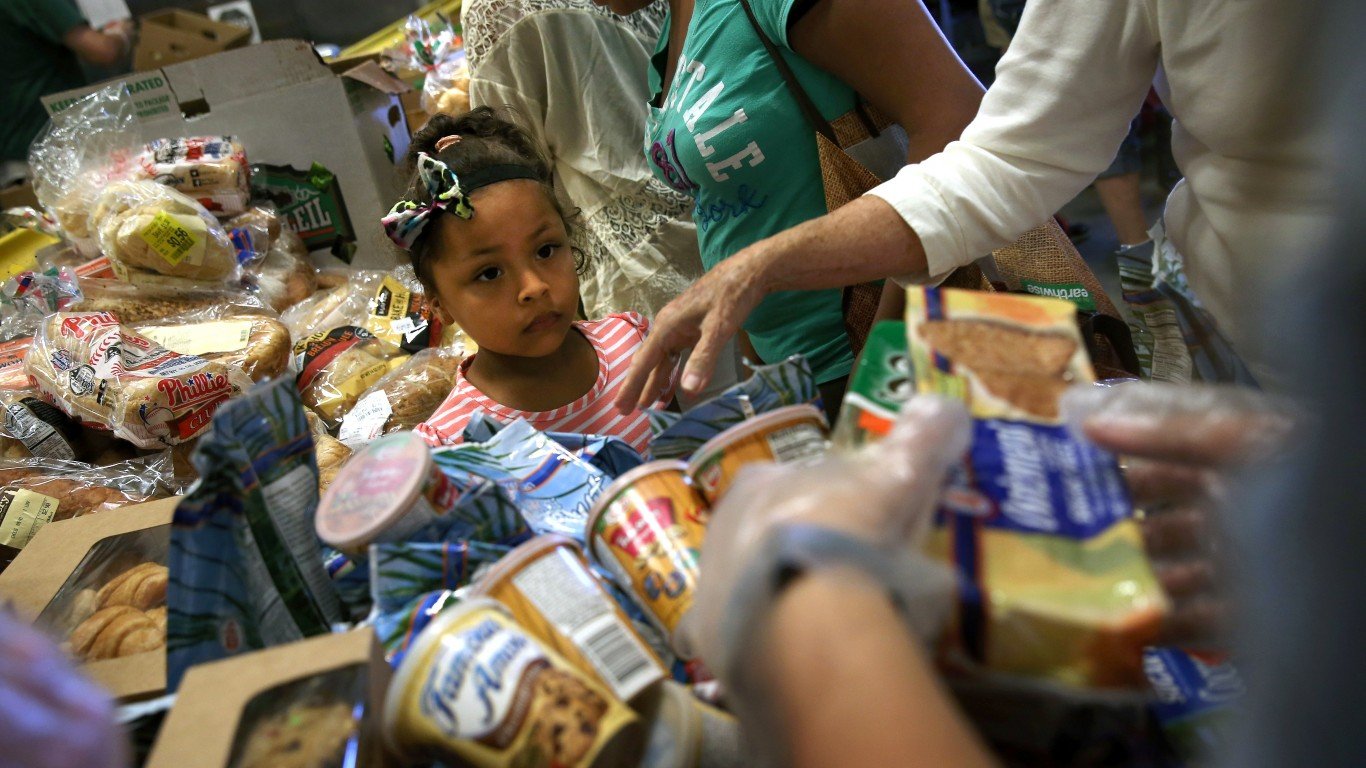
According to a Pew Research Center survey published in September, approximately one in every four adults in the U.S. have struggled to pay their bills since the coronavirus outbreak started. Savings, retirement accounts, support from friends and family, and food banks have helped many make ends meet.
The official poverty rate, developed in 1963, was not designed to account for these financial supports, nor does it factor costs such as living expenses and medical bills. It is based only on pre-tax income thresholds related to the cost of a minimum food diet and the number of individuals who depend on that income.
Many have criticized the official poverty rate for not being able to provide a more accurate picture of how many Americans are struggling financially. Federal welfare spending increased dramatically over the past 50 years. At the same time, prices of basic goods and services increased, while wage growth remained relatively stagnant for most workers.
In 2011, the U.S. Census Bureau began to regularly publish the supplemental poverty measure, a measure of poverty that takes into account cost of living, expenses such as medical costs and taxes, and anti-poverty subsidies like food stamps and unemployment insurance.
After adjusting for these measures, the U.S. poverty rate rises from 11.5% to 11.7% — while this may seem like a small increase, it amounts to an increase of 3.2 million people. In some states, the increase in poverty based on the two measures is far greater.
In an October 2019 report analyzing the effect of various anti-poverty subsidies, the Census Bureau determined that Social Security, refundable tax credits, the Supplemental Nutrition Assistance Program (SNAP), Supplemental Security Income, housing subsidies, child support payments, school lunch programs, Temporary Assistance for Needy Families (TANF), and unemployment insurance have the largest impact on the number of individuals considered to be living in poverty under the supplemental poverty measure.
In the same report, researchers determined that medical expenses, work expenses, Federal Insurance Contributions Act (FICA) tax, and federal income tax are the biggest factors pushing Americans below the poverty line as measured by the supplemental poverty measure.
To determine the states where poverty is worse than you think, 24/7 Wall St. ranked states by the percentage-point difference between the official poverty rate and supplemental poverty rate using data from the Census Bureau.
Data on the number and percentage of people living below the poverty line according to each measure are three-year averages for 2017, 2018, and 2019. Data on the percentage of households receiving SNAP (food stamps) benefits and median household income came from the Census Bureau’s American Community Survey and are for 2019. Data on regional price parity, or cost of living, came from the Bureau of Economic Analysis and are for 2018. Data on the average monthly SNAP benefit per each household member in fiscal 2018 is from the Center on Budget and Policy Priorities. Data on the percentage of eligible individuals who received Special Supplemental Nutrition Program for Women, Infants and Children (WIC) benefits in 2017 comes from the U.S. Department of Agriculture. All data are for the most recent period available.
Click here to see 16 states where poverty is than you might think.
16. Texas
> Supplemental poverty rate: 13.7% (6th highest)
> Official poverty rate: 12.7% (12th highest)
> Cost of living: 3.2% less than the national average (23rd highest)
> Median household income: $64,034 (22nd highest)
> Households receiving SNAP benefits: 11.2% (25th lowest)
According to the official poverty measure, 12.7% of the Texas population lives in households with incomes below the poverty threshold. After accounting for factors such as taxes, cost of living, medical costs, and other expenses included in the supplemental poverty measure (SPM), the estimated share of people living in poverty rises to 13.7%. The difference between Texas’ SPM and the official poverty rate is the 16th largest compared to all states. The SPM in Texas is itself the sixth highest in the nation.
One factor driving the higher SPM rate in Texas may be the burden of medical expenses incurred by the state’s large uninsured population. Uninsured Americans are often charged higher medical care costs than individuals with health insurance, and they have more difficulty paying their bills. In Texas, 18.4% of residents do not have health insurance, the highest uninsured rate of any state.
[in-text-ad]
15. Oregon
> Supplemental poverty rate: 11.0% (25th lowest)
> Official poverty rate: 9.8% (17th lowest)
> Cost of living: 1.1% more than the national average (14th highest)
> Median household income: $67,058 (18th highest)
> Households receiving SNAP benefits: 14.3% (7th highest)
Poverty-relief programs and government subsidies help ameliorate financial stress for people and families with low incomes, thus lowering the true level of poverty compared to the official rate. Such programs are used by relatively more households in Oregon — 14.3% of households use SNAP benefits, the seventh highest share in the nation — and yet the supplemental poverty measure is still higher than the official rate. After accounting for the effects of government subsidies, health care expenses, cost of living and other factors, approximately 47,000 more people in Oregon are living in poverty than measured by the official poverty rate.
As is generally the case in states where poverty is worse than it might seem, the cost of living in Oregon is higher than it is on average across the country.
[recirclink id=823850]
14. Illinois
> Supplemental poverty rate: 11.4% (21st highest)
> Official poverty rate: 10.4% (23rd lowest)
> Cost of living: 1.9% less than the national average (19th highest)
> Median household income: $69,187 (17th highest)
> Households receiving SNAP benefits: 12.4% (16th highest)
After adjusting for taxes, medical costs, cost of living, and other expenses, the percentage of Illinois residents living below the poverty line rises from 10.4% to 11.4%.
A Census Bureau study analyzing the effect of various anti-poverty subsidies determined that Social Security had the greatest effect on keeping people above the federal poverty threshold, as measured by the supplemental poverty measure. In Illinois, 29.5% of households receive Social Security income, the 10th smallest share of any state.
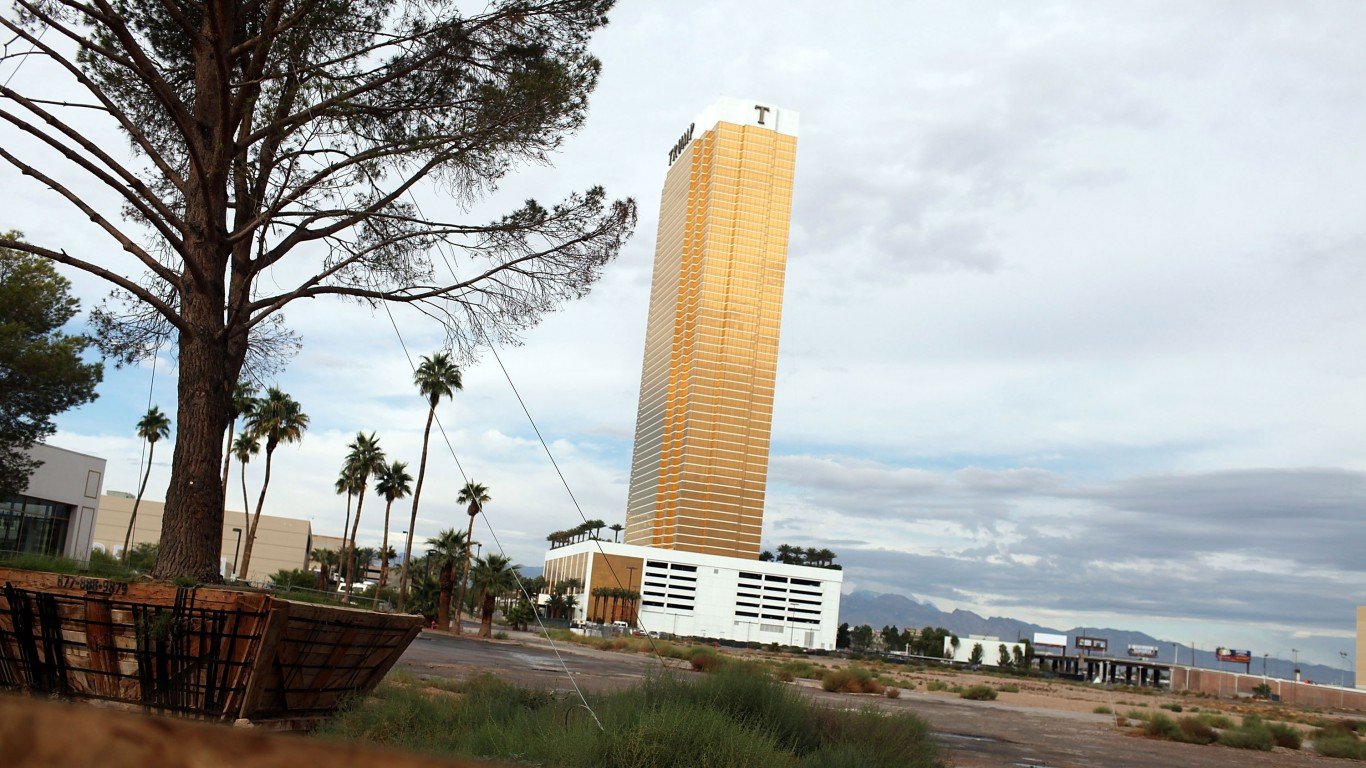
13. Nevada
> Supplemental poverty rate: 13.4% (8th highest)
> Official poverty rate: 12.1% (15th highest)
> Cost of living: 2.5% less than the national average (20th highest)
> Median household income: $63,276 (24th highest)
> Households receiving SNAP benefits: 11.4% (24th highest)
Nevada is one of 16 states in which the poverty rate increases after accounting for taxes, medical costs, and other expenses, as well as anti-poverty subsidies such as SNAP, TANF, and unemployment insurance. After adjusting for these costs and subsidies, the poverty rate in Nevada rises from 12.1% — the 15th highest — to 13.4%, the eighth highest.
One factor tied to the high rate of poverty in Nevada may be the low rate of homeownership in the state. Owning a home is one of the most effective ways for low-income families to build long-term wealth and avoid the cycle of poverty. In Nevada, just 56.6% of heads of households own their homes, the third lowest homeownership rate of any state.
[in-text-ad-2]
12. Connecticut
> Supplemental poverty rate: 11.2% (23rd highest)
> Official poverty rate: 9.7% (15th lowest)
> Cost of living: 6.1% more than the national average (8th highest)
> Median household income: $78,833 (6th highest)
> Households receiving SNAP benefits: 12.0% (18th highest)
After adjusting for expenses such as medical costs and taxes, as well as for anti-poverty subsidies like Social Security and SNAP, approximately 53,000 more people in Connecticut are considered to be living in poverty than measured by the official poverty rate. The difference raises the poverty rate in Connecticut from 9.7% to 11.2% — still lower than the national SPM of 11.7%.
As is the case in many of the states on this list, Connecticut residents are relatively affluent, contributing to the high cost of living across the state. The typical household in the state earns $78,833 annually, the sixth highest median household income in the nation. Just over 13% of households report annual incomes of $200,000 or more, the fifth highest such share of all states. Goods and services cost 6.1% more in Connecticut than they do nationwide, the eighth highest cost of living of any state.
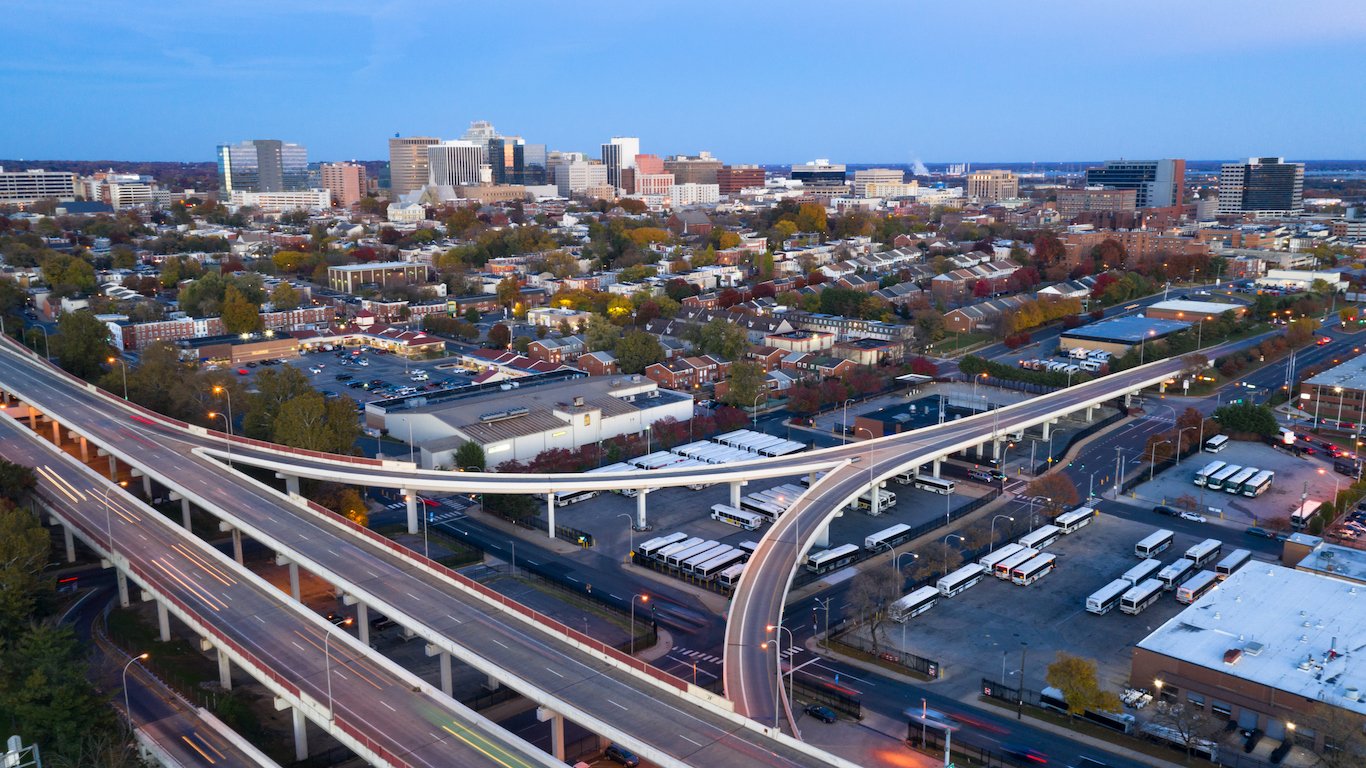
11. Virginia
> Supplemental poverty rate: 11.5% (20th highest)
> Official poverty rate: 9.7% (15th lowest)
> Cost of living: 2.0% more than the national average (12th highest)
> Median household income: $76,456 (10th highest)
> Households receiving SNAP benefits: 8.3% (10th lowest)
In most states, the official poverty rate is the same or slightly higher than the more accurate SPM. As is generally the case in more affluent states, however, the opposite is true in Virginia. When accounting for the effects of anti-poverty programs as well as the costs of living in the state, approximately 146,000 more state residents are considered to be living in poverty than measured by the official poverty rate.
For those in the state who are on the edge of official poverty thresholds, general expenses and the state’s high cost of living can be the difference between income below above the poverty line. Basic goods and services cost 2% more in Virginia than average prices nationwide, the 12th highest cost of living of all states.
[in-text-ad]
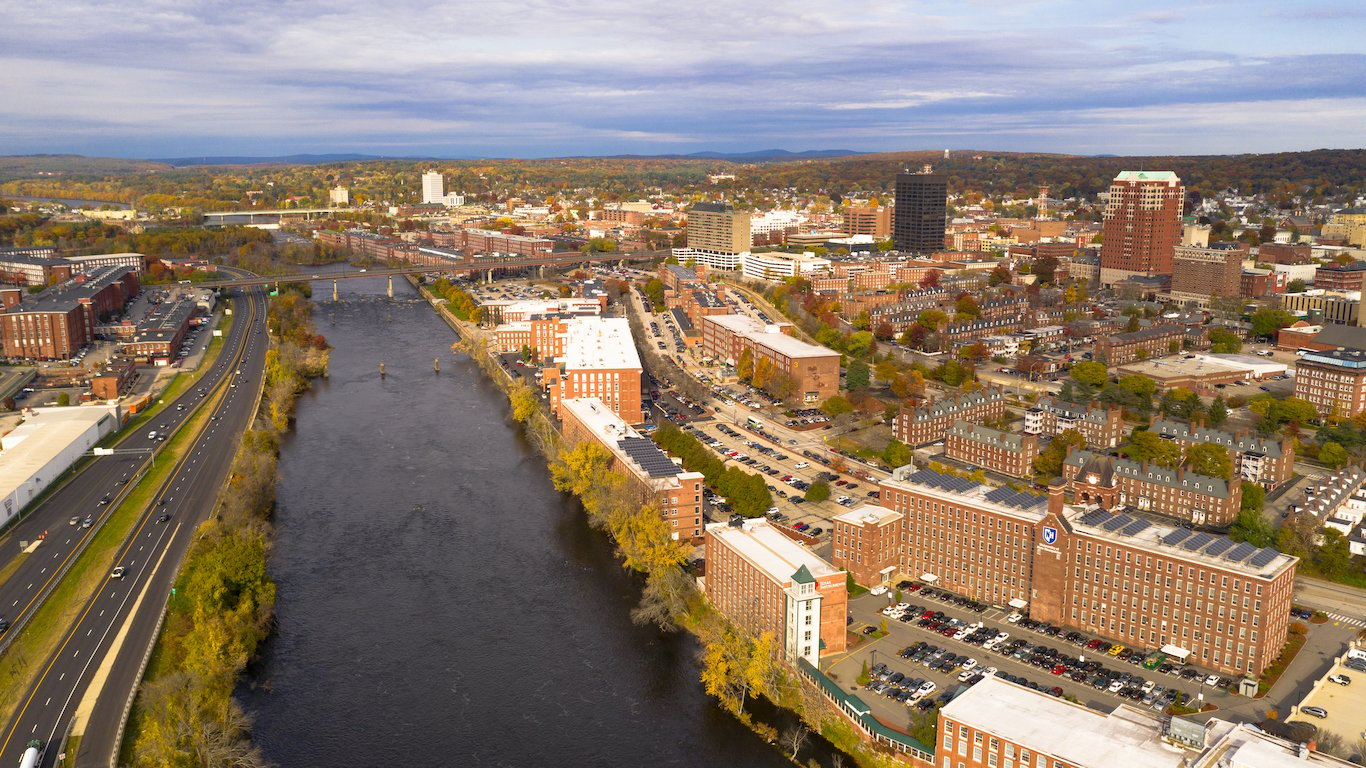
10. Massachusetts
> Supplemental poverty rate: 11.2% (23rd highest)
> Official poverty rate: 9.2% (12th lowest)
> Cost of living: 9.7% more than the national average (5th highest)
> Median household income: $85,843 (2nd highest)
> Households receiving SNAP benefits: 12.0% (19th highest)
The typical home in Massachusetts is valued at $418,600, the third highest median home value of any state and $178,000 more than the U.S. figure. On average, goods and services in the state cost 9.7 cents more on the dollar than they do nationwide, the fifth highest cost of living of any state.
After adjusting for the high cost of living, as well as other expenses such as out-of-pocket medical costs, taxes, and government aid programs and subsidies, the percentage of residents living in poverty in Massachusetts rises from 9.2% to 11.2% — a difference of 137,000 people.
[recirclink id=823589]
9. Colorado
> Supplemental poverty rate: 11.3% (22nd highest)
> Official poverty rate: 9.1% (11th lowest)
> Cost of living: 1.9% more than the national average (13th highest)
> Median household income: $77,127 (9th highest)
> Households receiving SNAP benefits: 7.5% (4th lowest)
When accounting for cost of living, as well as other expenses such as out-of-pocket medical costs, taxes, and government aid programs and subsidies, approximately 124,000 more people in Colorado are living in poverty than measured by the official poverty rate. The official rate, which at 9.1% is the 11th lowest of all states, rises would rise to 11.3% — the 22nd highest SPM.
One factor contributing to the increase may be low WIC recipiency. The federal Special Supplemental Nutrition Program for Women, Infants, and Children (WIC) program provides grant money to states for food, health care, and nutrition education for low-income women and children and has a significant impact on the share of individuals living below the poverty line. Just 40.7% of eligible women and children in Colorado receive WIC benefits, the fifth smallest share of any state.
8. New York
> Supplemental poverty rate: 14.4% (5th highest)
> Official poverty rate: 12.1% (15th highest)
> Cost of living: 16.4% more than the national average (2nd highest)
> Median household income: $72,108 (14th highest)
> Households receiving SNAP benefits: 14.9% (4th highest)
In most states where poverty is worse than you might think, the official poverty rate is relatively low, but not in New York. The state’s 12.1% poverty rate is higher than the national rate. The already high level of poverty in New York rises further under the SPM to 14.4% – the fifth highest supplemental poverty rate of all states.
High rents in New York City — where over 40% of the state’s population lives — are likely one factor driving the high SPM rate. The typical home in New York state costs $338,700, the eighth highest median home value of any state. Overall, goods and services cost 16.4% more in the state than they do on average nationwide, the second highest cost of living in the country.
[in-text-ad-2]
7. Florida
> Supplemental poverty rate: 15.4% (3rd highest)
> Official poverty rate: 12.9% (11th highest)
> Cost of living: 0.6% more than the national average (15th highest)
> Median household income: $59,227 (17th lowest)
> Households receiving SNAP benefits: 12.4% (14th highest)
According to the official poverty measure, 12.9% of Florida residents live in households with income below the poverty threshold. After accounting for factors like taxes, cost of living, and other expenses included in the supplemental poverty measure, however, the percentage of residents living in poverty rises to 15.4% — the third highest SPM of any state. Under the revised measure, approximately 541,000 more people in Florida are living in poverty than measured by the official poverty rate.
One expense contributing to the high SPM in Florida may be the medical costs incurred by the state’s large uninsured population. Uninsured Americans are often subject to higher medical care costs than individuals with health insurance, and it is more difficult for them to pay their bills. In Florida, approximately 13.2% of residents do not have health insurance, the fourth highest uninsured rate of any state.
6. New Hampshire
> Supplemental poverty rate: 8.3% (7th lowest)
> Official poverty rate: 5.6% (the lowest)
> Cost of living: 6.0% more than the national average (9th highest)
> Median household income: $77,933 (8th highest)
> Households receiving SNAP benefits: 6.9% (3rd lowest)
While reporting the sixth largest difference between its official and supplemental poverty rates, New Hampshire appears to have one of the most manageable poverty problems of all states. The state’s official poverty rate and SPM are 5.6% and 8.3%, respectively, the lowest and 7seventh lowest rates in the nation.
The Census Bureau identified the Supplemental Nutrition Assistance Program (SNAP) as the third most impactful anti-poverty program after Social Security and refundable tax credits, as measured by the difference between the official poverty rate and supplemental poverty measure. In New Hampshire, likely because of how relatively few people in the state are living in poverty, only 6.9% of households receive SNAP benefits, the third lowest such share of all states.
The high cost of living in New Hampshire, where prices are estimated at 6.0% higher than average costs of goods and services nationwide, is likely one of the main drivers of the large difference in the state’s official and supplemental poverty measures.
[in-text-ad]
5. Delaware
> Supplemental poverty rate: 10.5% (21st lowest)
> Official poverty rate: 7.6% (5th lowest)
> Cost of living: 1.2% less than the national average (18th highest)
> Median household income: $70,176 (16th highest)
> Households receiving SNAP benefits: 11.1% (23rd lowest)
More than one in four children in Delaware live in households that receive supplemental security income, cash public assistance income, or SNAP benefits — the ninth largest share of all states.
Despite the broad usage of these benefits, after adjusting for such anti-poverty subsidies as well as medical expenses and taxes, the percentage of Delaware residents in poverty increases from 7.6%, the fifth lowest rate, to an SPM rate of 11.9%. While the state’s SPM is 21st lowest compared to other states, the difference from the official rate is larger than in all but four other states.
[recirclink id=823781]

4. Hawaii
> Supplemental poverty rate: 13.4% (8th highest)
> Official poverty rate: 9.4% (13th lowest)
> Cost of living: 18.1% more than the national average (the highest)
> Median household income: $83,102 (4th highest)
> Households receiving SNAP benefits: 11.2% (24th lowest)
The SPM takes into account regional geographic variations in housing costs to better understand how many individuals are struggling financially in a given area. Hawaii has the most expensive housing market in the country, with the typical home valued at a stunning $669,200 — nearly three times the U.S. median home value of $240,500. Goods and services cost 18.1% more in Hawaii than they do on average nationwide, the highest cost of living of any state.
When accounting for these factors, approximately 56,000 more people in Hawaii are living in poverty than measured by the official poverty rate. This difference results in the fourth largest percentage point difference between the state’s official and supplemental poverty measures, which at 9.4% and 13.4% are the 13th lowest and 8th highest rates in the nation, respectively.
3. New Jersey
> Supplemental poverty rate: 12.5% (15th highest)
> Official poverty rate: 8.2% (6th lowest)
> Cost of living: 15.2% more than the national average (4th highest)
> Median household income: $85,751 (3rd highest)
> Households receiving SNAP benefits: 8.0% (7th lowest)
After adjusting for medical costs, work expenses, taxes, and other factors included in the supplemental poverty measure, the percentage of New Jersey residents considered living below the poverty line rises from 8.2% — the sixth lowest poverty rate of any state — to 12.5%, the 15th highest supplemental poverty rate.
One factor accounting for the large spike may be the high cost of living in New Jersey. Goods and services cost 15.2% more in the state than they do on average nationwide, the fourth highest markup of any state. Despite the high cost of living, the average SNAP benefit payout is $111 per household member per month, the ninth lowest amount. Just 74.0% of eligible individuals receive SNAP, also the ninth smallest such figure.
[in-text-ad-2]
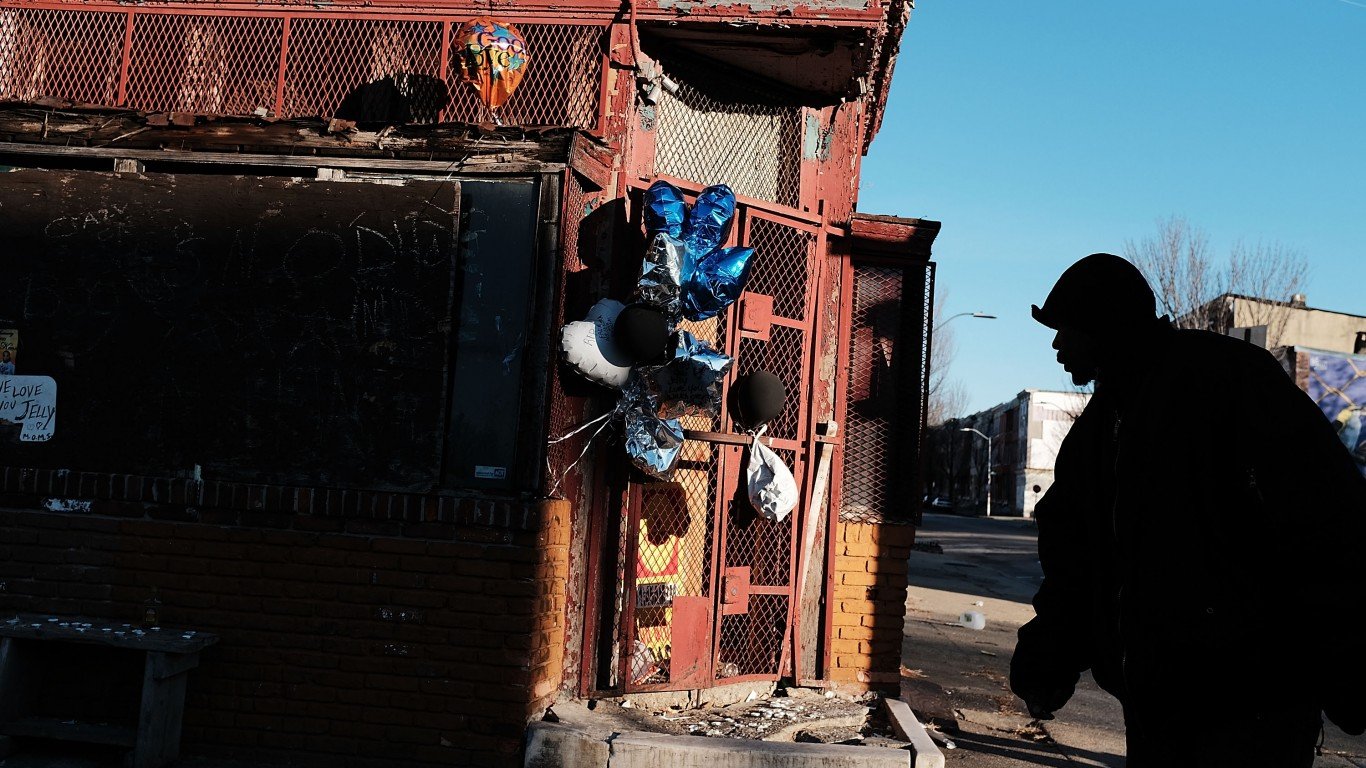
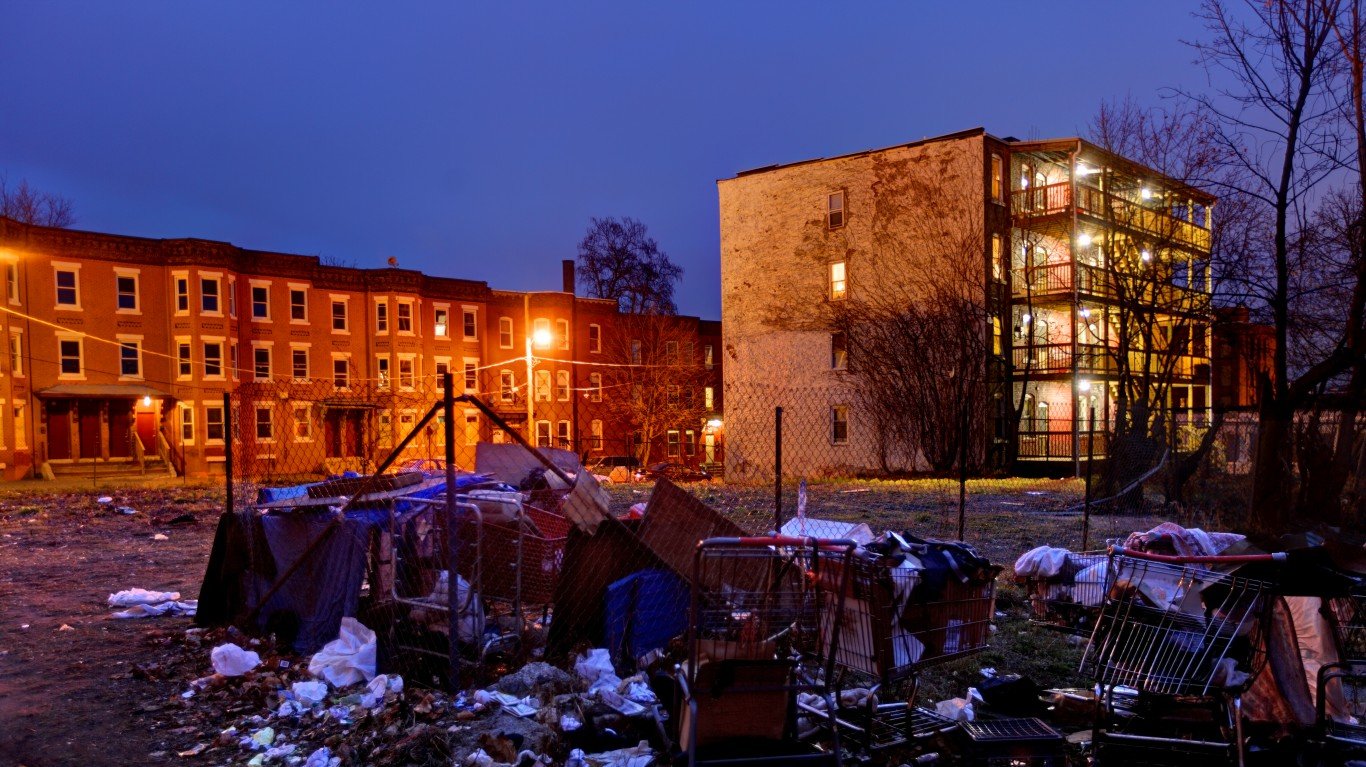
2. Maryland
> Supplemental poverty rate: 12.0% (18th highest)
> Official poverty rate: 7.6% (5th lowest)
> Cost of living: 8.4% more than the national average (6th highest)
> Median household income: $86,738 (the highest)
> Households receiving SNAP benefits: 10.4% (20th lowest)
Based on median household income, Maryland residents are the wealthiest in the nation. The typical household brings in $86,738 annually, compared to the median income nationwide of $65,712. The typical home in Maryland is worth $332,500, the ninth highest median home value of any state and over $90,000 more than the U.S. median. On average, goods and services cost 8.4% more in Maryland than they do on average nationwide, the sixth highest cost of living of any state.
High pre-tax incomes, home values, and cost of living correspond with a low official poverty rate of 7.6%, which is common among states on this list where the official poverty rate underestimates the level of financial distress. When accounting for these additional factors affecting family budgets, approximately 267,000 more people in Maryland are living in poverty than measured by the official poverty rate.
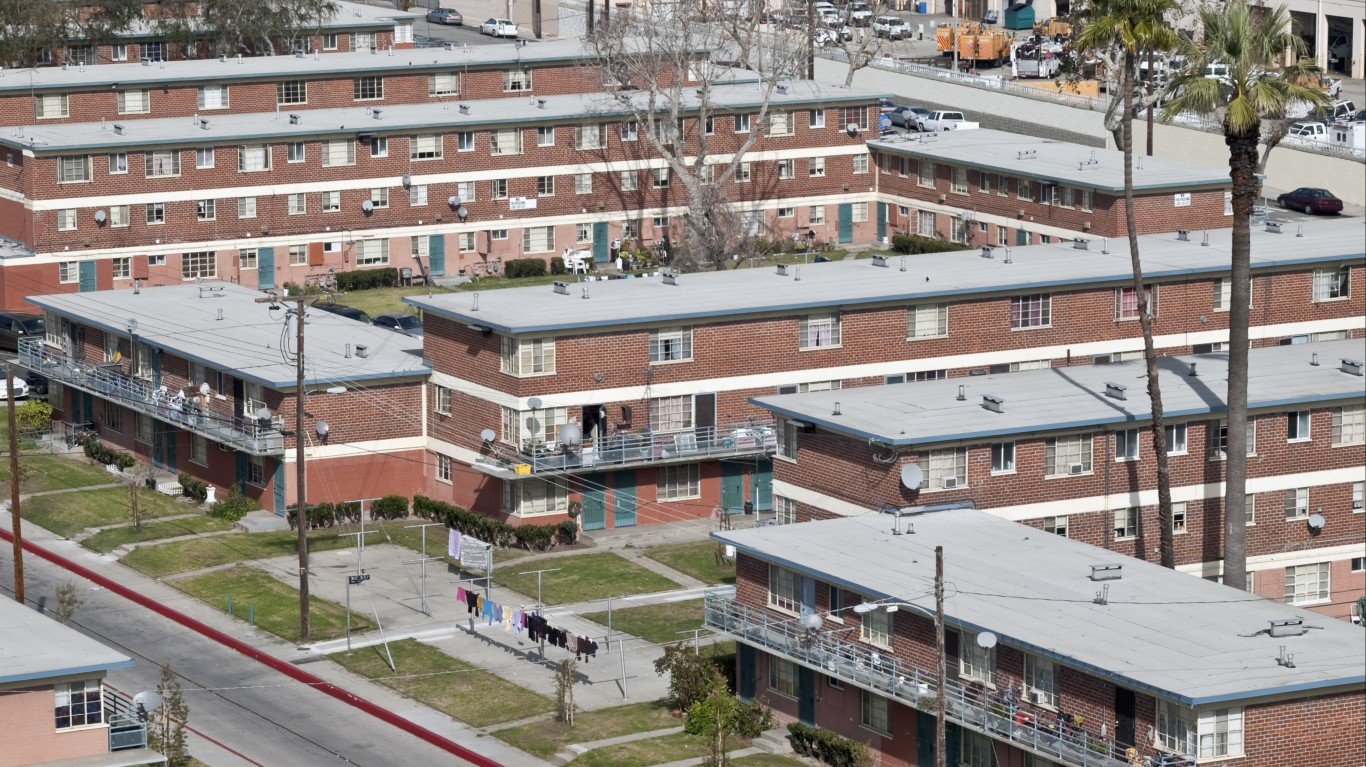
1. California
> Supplemental poverty rate: 17.2% (the highest)
> Official poverty rate: 11.4% (20th highest)
> Cost of living: 15.4% more than the national average (3rd highest)
> Median household income: $80,440 (5th highest)
> Households receiving SNAP benefits: 9.4% (13th lowest)
Under the official rate, 11.4% of California residents are considered to be living below the poverty line, roughly in line with the 11.5% national poverty rate. After adjusting for medical costs, taxes, and other expenses as well as government aid programs and subsidies, however, the percentage of people living in poverty rises to 17.2% — the highest supplemental poverty measure rate of any state and the largest gap between the two measures.
A Census Bureau study analyzing the impact of various anti-poverty subsidies determined that Social Security and SNAP have the largest and third largest effect of any program on keeping individuals above the federal poverty line. In California, however, just 28.4% of eligible households receive Social Security benefits, the sixth smallest share of any state. Similarly, fewer than 10% of households receive SNAP benefits, the 13th smallest share.
Contact [email protected] for any questions or corrections.