The U.S. poverty rate stood at 11.4% in 2020, up 1.0 percentage points from 2019, according to Census Bureau estimates. This marked the first increase after five consecutive yearly declines. According to the most recent statistics, 37.2 million people live below the poverty line, 3.3 million more than in 2019.
These figures are based on the official poverty rate, a measure that was developed in 1963 and is based on pre-tax cash income thresholds and the number of individuals who depend on the income. The way of calculating this measure has remained largely unchanged. Today, the federal poverty threshold for a family of four is an income of $27,479. (See what income a family needs to cover normal living expenses in each state.)
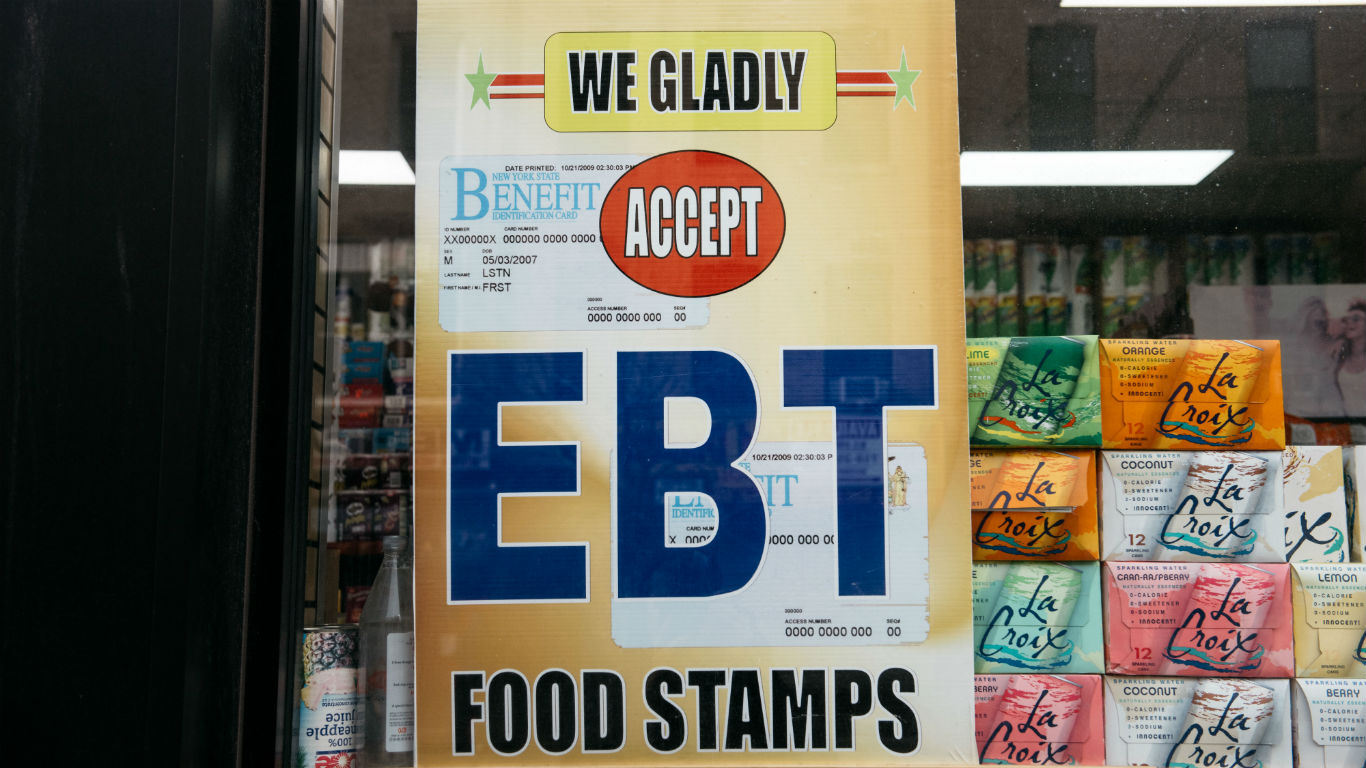
Over time, critics have pointed out the official poverty rate may not provide the most accurate picture of how many Americans are struggling financially. In response, the Census developed in 2010 the supplemental poverty measure, which takes into account geographic variations in the cost of living, expenses such as medical bills and taxes, and cash and non-cash subsidies and benefits such as Supplemental Nutrition Assistance Program (food stamps) and unemployment insurances.
The supplemental poverty rate helps provide a more complete picture of poverty – where subsidies work to help low-income residents and where the cost of living makes poverty even worse.
To determine the states where poverty is worse than you might think, 24/7 Wall St. ranked states based on the percentage-point difference between the official poverty rate and supplemental poverty measure, using three-year averages for 2018 to 2020 with data from the U.S. Census Bureau. To break ties, we used the official poverty rate. Data on the percentage of households receiving SNAP benefits and median household income came from the Census’ American Community Survey and are five-year averages for 2020. Data on regional price parity, or cost of living, came from the Bureau of Economic Analysis and are for 2020.
The national supplemental poverty measure was 9.1% in 2020, 2.3 percentage points lower than the official poverty rate of 11.4%. In the 11 states on the list, however, the supplemental poverty measure is 1.2 percentage points higher than the respective state official poverty measure.
One reason for the higher supplemental poverty rate could be the higher cost of living in these states. In all but one of the 11 states, the cost of living is above the national average. (Find out if these are also the states where the most families need food stamps?)
The official poverty rate in most of the 11 states is lower than the national benchmark of 11.4%. Only Florida and New York have a higher official poverty rate. However, the supplemental poverty rate is higher than the national benchmark of 9.1% in 10 of the 11 states, in some cases considerably higher. California’s supplemental poverty rate is the highest at 15.4%.
Click here to see states where poverty is much worse than you think

11. New Hampshire
> Supplemental poverty rate: 6.5% (4th lowest)
> Official poverty rate: 5.3% (the lowest)
> Cost of living: 3.7% greater than national avg. (8th highest)
> SNAP recipiency: 6.4% (3rd lowest)
> Median household income: $77,923 (7th highest)
[in-text-ad]

10. Massachusetts
> Supplemental poverty rate: 9.4% (22nd lowest)
> Official poverty rate: 8.2% (8th lowest)
> Cost of living: 7.4% greater than national avg. (5th highest)
> SNAP recipiency: 11.6% (21st highest)
> Median household income: $84,385 (3rd highest)
[recirclink id=1092222]

10. Florida
> Supplemental poverty rate: 14.0% (3rd highest)
> Official poverty rate: 12.8% (13th highest)
> Cost of living: 0.7% greater than national avg. (15th highest)
> SNAP recipiency: 13.2% (9th highest)
> Median household income: $57,703 (14th lowest)

8. Virginia
> Supplemental poverty rate: 10.1% (24th highest)
> Official poverty rate: 8.8% (12th lowest)
> Cost of living: 1.0% greater than national avg. (14th highest)
> SNAP recipiency: 7.9% (8th lowest)
> Median household income: $76,398 (10th highest)
[in-text-ad-2]

7. New York
> Supplemental poverty rate: 13.3% (5th highest)
> Official poverty rate: 11.8% (18th highest)
> Cost of living: 10.2% greater than national avg. (4th highest)
> SNAP recipiency: 14.3% (7th highest)
> Median household income: $71,117 (14th highest)

6. Delaware
> Supplemental poverty rate: 9.8% (25th lowest)
> Official poverty rate: 8.1% (7th lowest)
> Cost of living: -2.1% less than national avg. (21st highest)
> SNAP recipiency: 10.6% (23rd lowest)
> Median household income: $69,110 (16th highest)
[in-text-ad]

5. Colorado
> Supplemental poverty rate: 11.2% (16th highest)
> Official poverty rate: 9.3% (19th lowest)
> Cost of living: 2.9% greater than national avg. (11th highest)
> SNAP recipiency: 7.2% (6th lowest)
> Median household income: $75,231 (11th highest)
[recirclink id=1129265]

4. New Jersey
> Supplemental poverty rate: 10.0% (25th highest)
> Official poverty rate: 7.6% (4th lowest)
> Cost of living: 11.2% greater than national avg. (2nd highest)
> SNAP recipiency: 8.4% (10th lowest)
> Median household income: $85,245 (2nd highest)

3. Hawaii
> Supplemental poverty rate: 12.0% (10th highest)
> Official poverty rate: 9.5% (22nd lowest)
> Cost of living: 12.0% greater than national avg. (the highest)
> SNAP recipiency: 10.7% (24th lowest)
> Median household income: $83,173 (4th highest)
[in-text-ad-2]

2. Maryland
> Supplemental poverty rate: 10.8% (18th highest)
> Official poverty rate: 8.1% (7th lowest)
> Cost of living: 6.5% greater than national avg. (7th highest)
> SNAP recipiency: 10.1% (17th lowest)
> Median household income: $87,063 (the highest)

1. California
> Supplemental poverty rate: 15.4% (the highest)
> Official poverty rate: 11.0% (21st highest)
> Cost of living: 10.4% greater than national avg. (3rd highest)
> SNAP recipiency: 9.0% (13th lowest)
> Median household income: $78,672 (6th highest)
Contact [email protected] for any questions or corrections.